

This project is from the Exmouth Sub-Basin, NW Australia. It forms the most southern rift basin in the Carnarvon Basin. The carbonate reservoirs are typified by complex stratigraphic architecture, digenesis and lithology variations. The steady subsidence of the Exmouth Plateau from the Late Cretaceous resulted in deposition of carbonate chalks, marls and oozes which were subjected to burial, compaction and digenesis.
Volumetric noise cancellation attenuated noise whilst minimizing the loss of primary geological signal. We systematically applied edge preserving methods for attenuating both random noise and high-spatial frequency coherent noise that may be masking features such as karsts. The Spectral Enhancement brought a white spectrum to the data where all frequencies contribute equally and thin bed events are resolved (Figure 1).
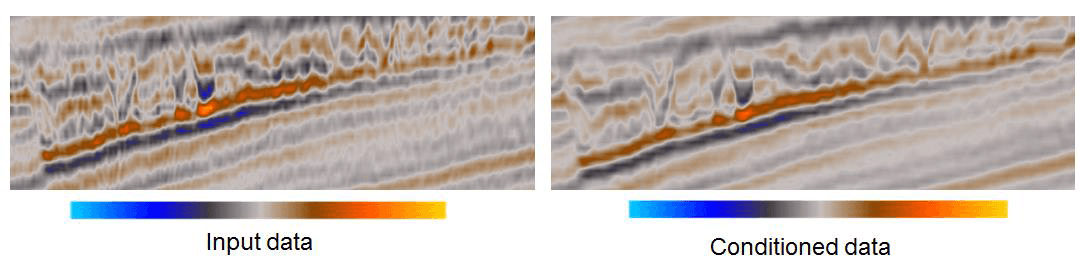 |
| Figure 1. Noise Cancellation and Spectral Enhancement techniques were applied to the data, improving the imaging of the carbonate interval while preserving the edges and subtle details of the geological features. |
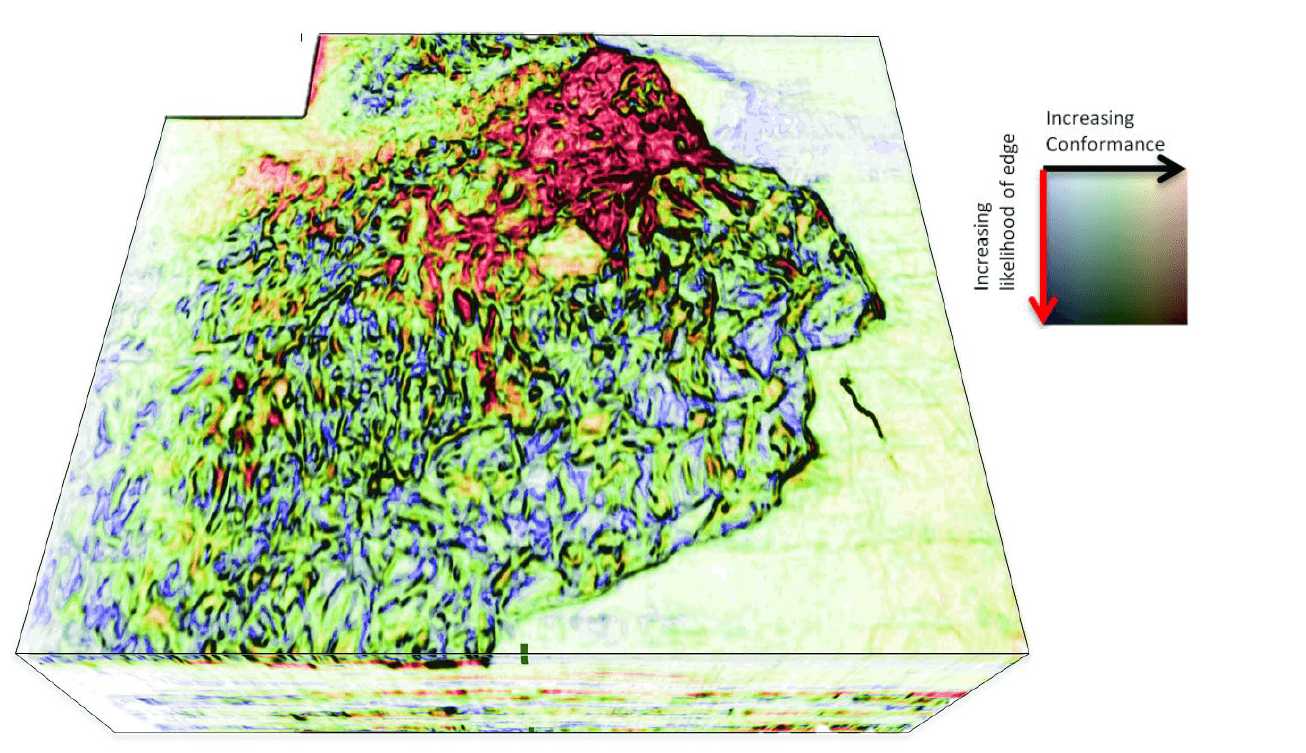
Tailored attribute analysis within the carbonate environment utilised both trace-based and multi-trace attributes to identify and extract the karst network and depositional geometries (Figure 2).
 |
|
Figure 2. The TensorEnvelope combo volume shows stratigraphic and structural information combined in a single display. The tensor attribute highlights the edges of the karsts, and the envelope highlights high-amplitude stable areas.
|
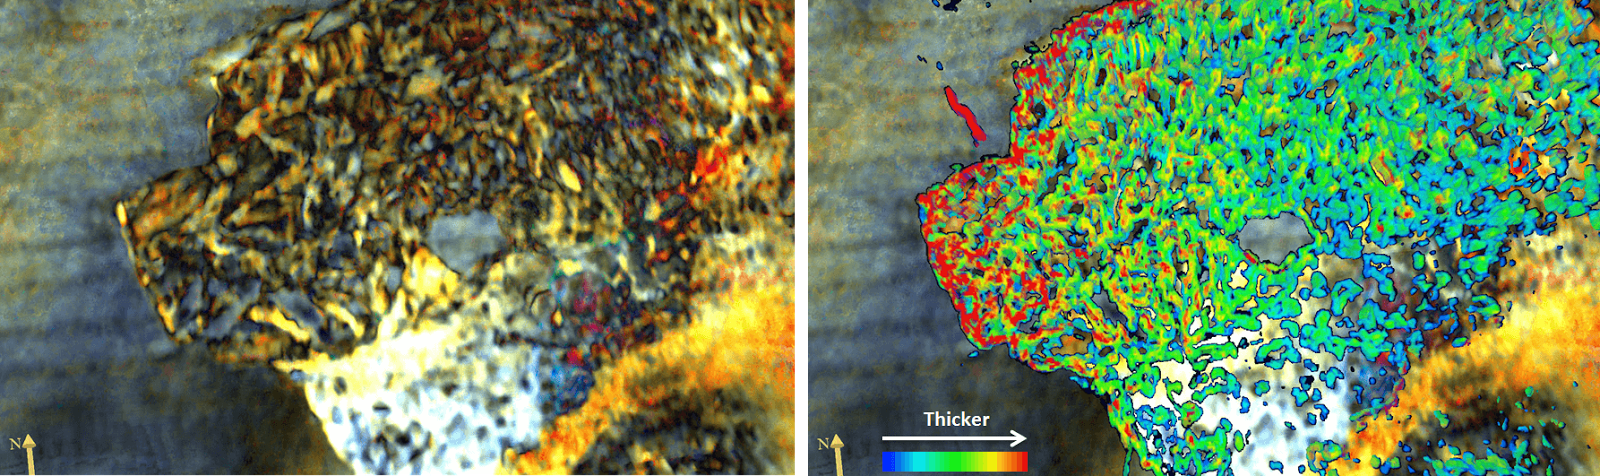
Frequency Decomposition using a method analogous to a Fast Fourier Transformation and an algorithm based on matching pursuit aided the identification of dissolution features.The ability to extract these features as geobodies was made possible by both the Adaptive Geobodies and volumetric geobodies technique. The geobodies can then be colour coded by thickness to easily identify the areas with thicker karsts (Figure 3).
 |
|
Figure 3. HD Frequency Decomposition and RGB blending (on the left) identified the dissolution features as areas of high-frequency response. The dissolution features were then extracted as geobodies and colour-coded by thickness (on the right).
|
