

Nicholas Cooke (ffA), Peter Szafian (ffA), Robert Gruenwald (SASOL) and Lothar Schuler (SASOL) present a modelling technique to understand the colour response from an HDFD blend above and below a known gas water contact of a proven gas accumulation in the Sofala Concession.
Since the introduction and application of frequency decomposition methods to seismic data it has routinely been used as a seismic geomorphology tool, a bed thickness indicator and, in some instances, a direct hydrocarbon indicator (DHI) (Chopra, 2012). When applied to 3D post-stack seismic data, frequency decomposition allows us to examine specific parts of the frequency spectrum and generate frequency specific reflectivity, magnitude and phase 3D volumes. Frequency magnitude volumes are used in conjunction with RGB (red, green and blue) blending and have become a common tool in the oil industry for looking at both structural and stratigraphic features within seismic data.
see full article...
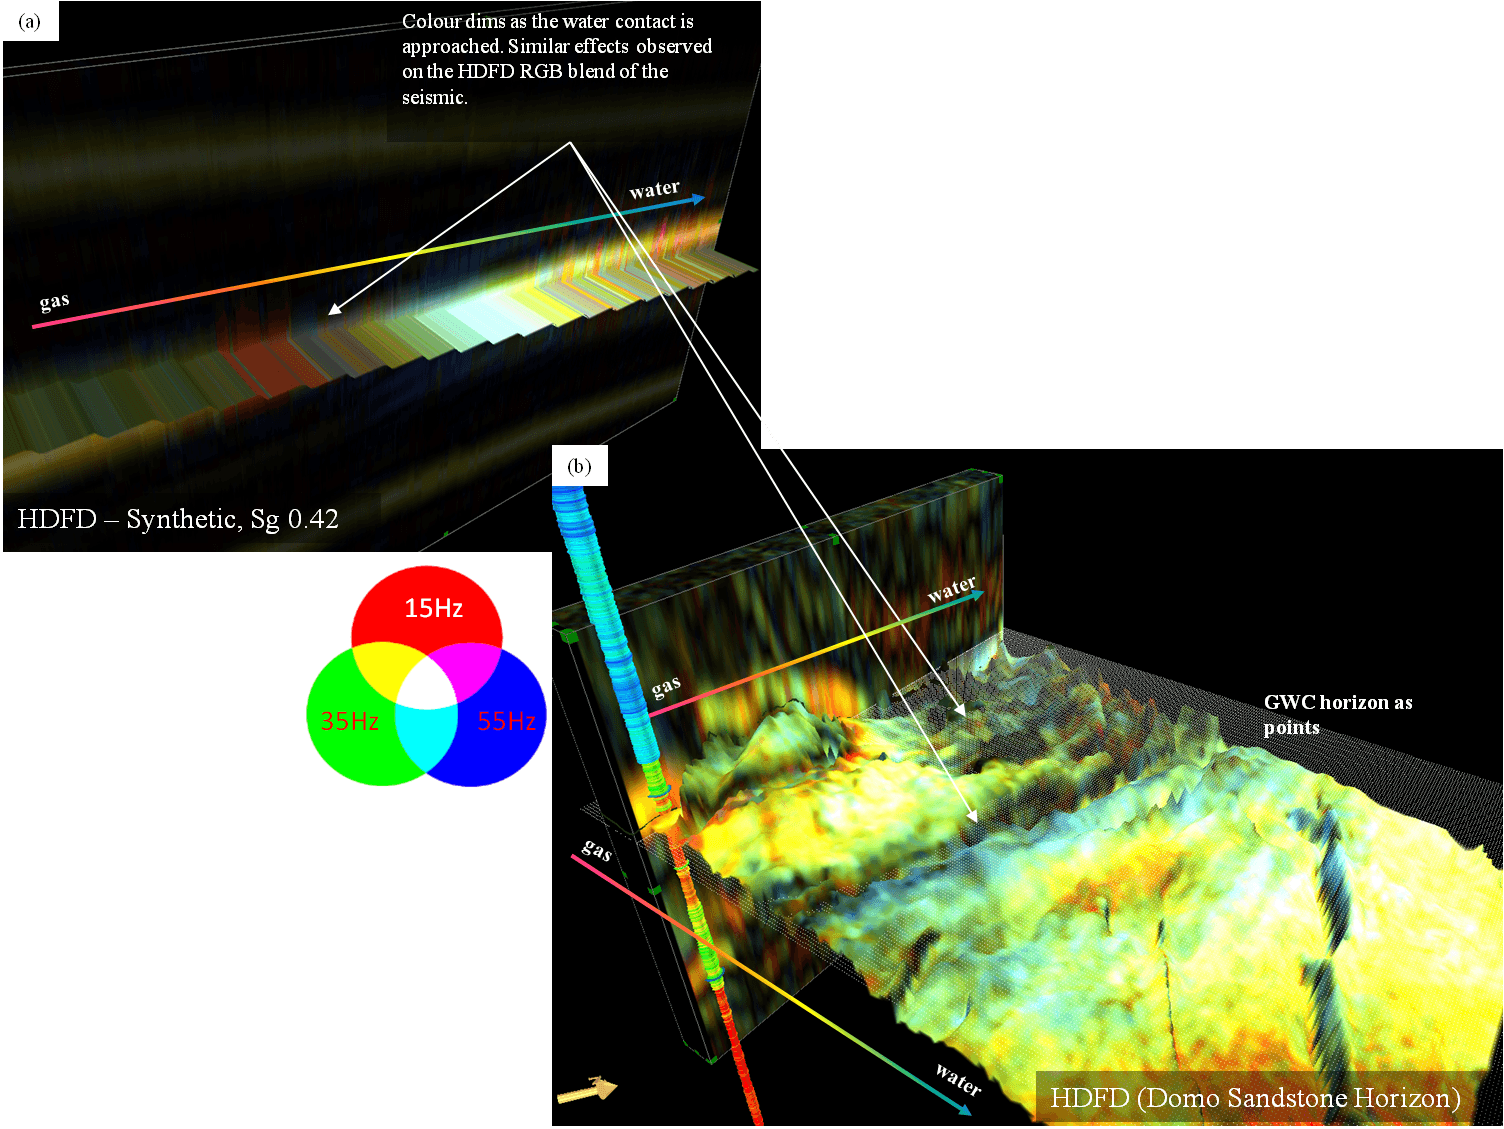 |
| Results compared from the HDFD RGB blends of the real data and synthetic models. (a) Shows a HDFD RGB blend of the synthetic layer model, with Sg 0.42, Sw 0.58 on a line and a horizon which tracks the sand above and below the gas-water contact. (b) Shows the HDFD RGB blend from the seismic data on a line and draped on the Demo Sandstone horizon. The known gas-water contact is visible as a horizon with points. |
