Auditable volumetrics for fast and effective evaluation of hydrocarbon resources
Within the newest release 2018.2, Geoteric is enhancing the exploration workflow by introducing a ‘Volumetrics’ tool which allows calculation of oil and gas resource estimates at any point during horizon interpretation and editing. Results can be saved within the project or into an external file which can be updated following further data acquisition and/or refinement of the interpretation. Continue reading for a brief introduction to the tool and be sure to download Geoteric 2018.2 today!
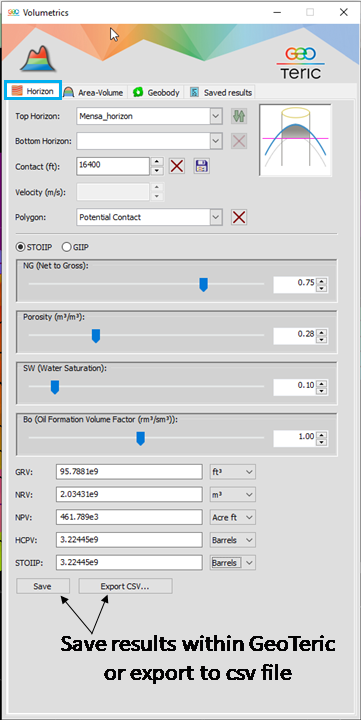
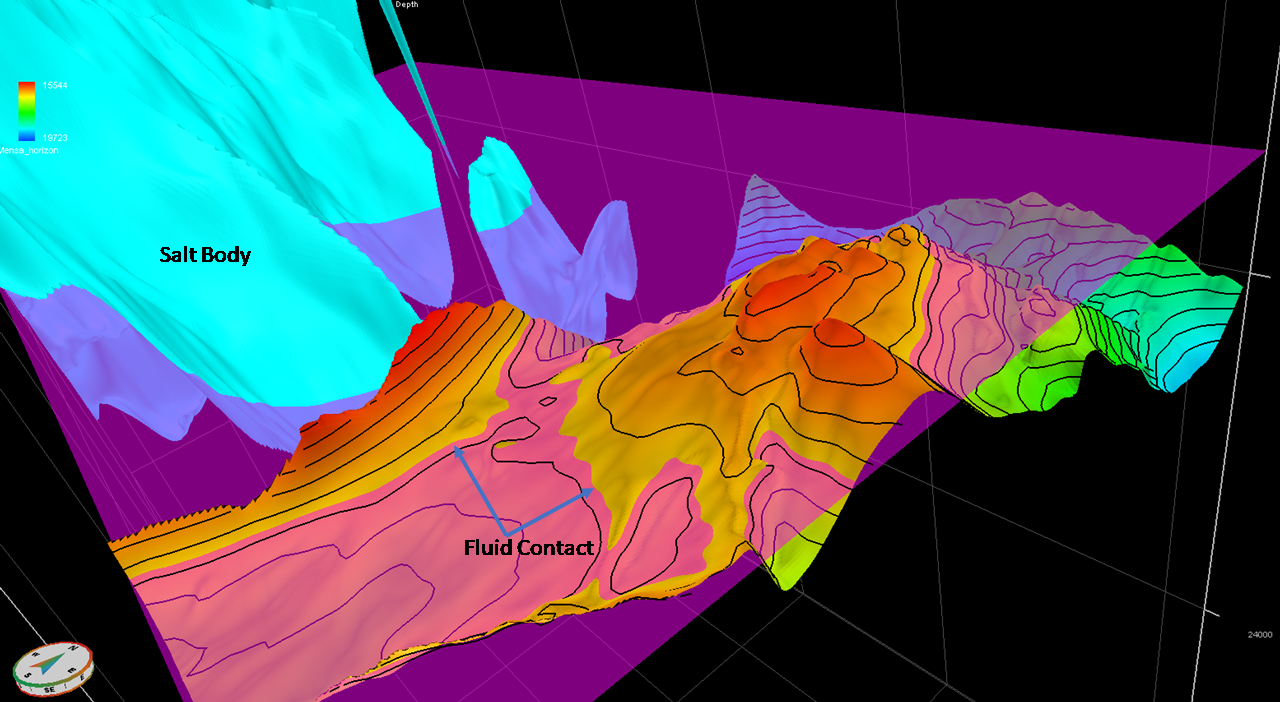
The Volumetrics user interface can be accessed from the ‘Tools’ dropdown menu or by simply right-clicking on a horizon or geobody in either the 3D window or the data tree. The tool will open to the default STOIIP (stock tank oil initially in place) calculation under the ‘Horizon’ tab shown in Figure 1. In this window, you can define reservoir geometry by selecting top and base horizons, a fluid contact, and a polygon to limit the aerial extent of the volume calculation. Note that if the project is in time, an interval velocity can be supplied to convert the calculated reservoir height from time to depth. The schematic at the top right of the window highlights which structural elements are being used in the calculation. When a depth to fluid contact is used as an input, this is not only shown in the schematic, but also in the 3D scene as a semi-transparent pink plane (Figure 2). This plane will update automatically as the contact depth is adjusted.
Once the geometry is defined, you can then input average values for net-to-gross, porosity, water saturation, and formation volume factor. The resulting outputs, which can be reported in units of cubic feet, cubic meter, acre-feet, or barrels, can then be saved in GeoTeric and recalled at any time or output as a .csv file.
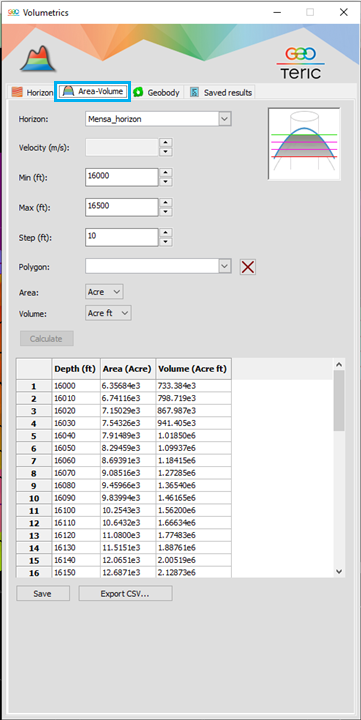
The second tab, ‘Area-Volume’, calculates depth-area-volume pairs for use in probabilistic volumetrics estimates. In this case, a single top horizon is selected along with upper and lower depths and a depth interval. A polygon can also be used to limit the calculation. The outputs from this, shown in Figure 3, can then be exported and used in a probabilistic modelling software to assess the effect uncertainty in “container” shape has on expected hydrocarbon volumes.
The third and final calculation available in the Volumetrics tool is found in the ‘Geobody’ tab (Figure 4). In this case, the calculation is for STOIIP or GIIP using a geobody rather than bounding surfaces to define reservoir geometry. If the project is in time, you can check and edit the velocity associated with that geobody by using the ‘Adaptive Geobody Metrics’ button.
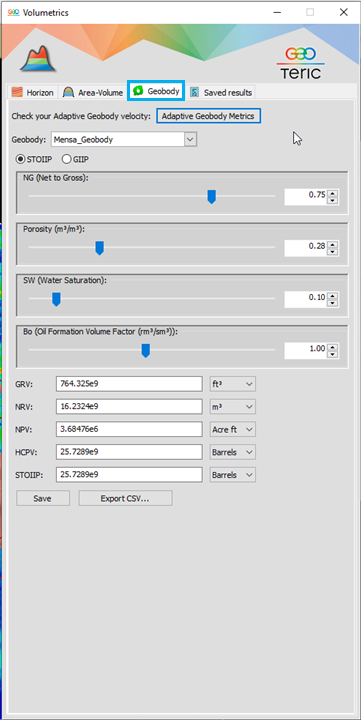
Figure 4: Alternative to using horizons and polygons to define top and base reservoir, a geobody can be used to define the surface bounding the hydrocarbon volume.
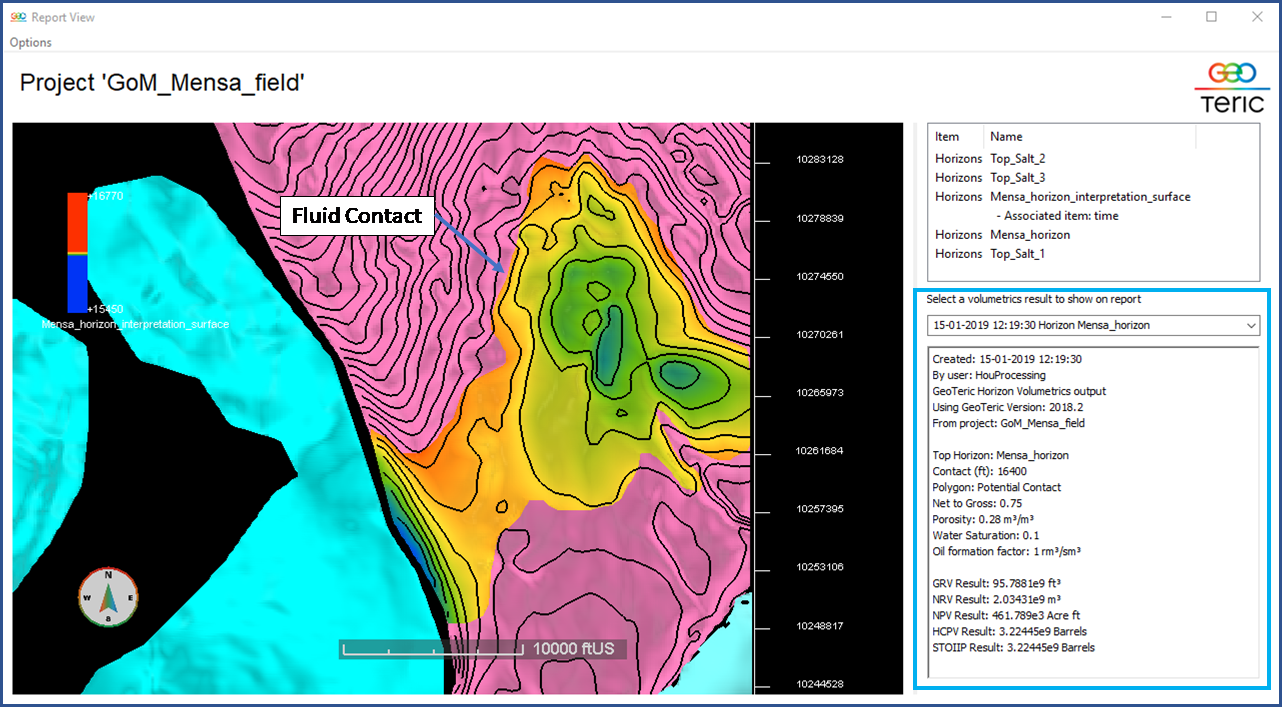
Finally, the ‘Saved Results’ tab can be used to view any previously saved volumetric assessment within the GeoTeric project, including the input parameters to the calculation. Additionally, these results can be used in ‘Report View’ (Figure 5) to promote effective sharing and collaboration.