Why do Interactive Facies Classification (IFC+) in Geoteric?
IFC+ offers the interpreter an advanced method of Seismic Facies classification in a rich multi-attribute environment. By utilizing the optimized blends, attributes and volumes created in Geoteric, the IFC+ provides the optimal solution for translating the geology that you see in your data, into classified facies that can be embedded directly into the reservoir model.
The IFC+:
- Provides a means to transform the geology revealed in colour blends, attributes and volumes into facies, and bridge the gap between visual interpretation and classification.
- Affords the interpreter full control to delineate and tune the facies classes they see, or can operate in a partially supervised manner to discriminate subtle changes in the data that may be visually undetectable.
- Allows the results to be clearly interrogated and validated against hard data.
- Generates 3D results that can be directly imported into the reservoir model or volumetric estimates.

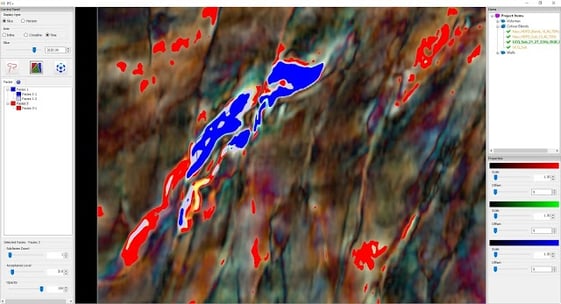
IFC+ tool interface.
Setting up your classification
To start, the interpreter chooses the optimized inputs they want to interpret facies classes from. These can include Frequency Decomposition RGB Blends, attributes, or imported results such as rock property inversions that highlight the features or geological bodies of interest. The best inputs are the ones that have been most effectively optimized to capture the facies variations, by carefully adjusting the frequency ranges or parameters in GeoTeric’s interactive tools. Up to ten volumes and one RGB blend can be used simultaneously in the tool.
By default the IFC+ will generate facies classes across the whole survey extent, however the classification can also be constrained to a 3D geobody that may delineate the reservoir or zone of interest. The geobody can be obtained by converting an Adaptive Geobody to a volume, and used in the classification by setting the opacity such that it does not obscure the other volumes. For information on how to do that, please see the video here.
Picking sample areas
Facies classes are interpreted by drawing small sample areas that capture the features of interest. This can be done in a localized manner, where the interpreter defines a single sample area to specify each individual facies, or pick sample areas crossing multiple features, which allows the IFC+ to detect the trends present in the data using a Gaussian Mixture Model and output a number of sub-facies, matching these trends. The interpreter then has the option to accept or adjust these detected sub-facies. To see how to pick sample areas, click here. Picking sample areas along wellbores is equally easy: simply by specifying two markers along a well trajectory, the IFC+ captures the seismic data values along the path between them and builds the sample area that way, also defining sub-facies according to the trends detected in the data. For picking sample areas along wellbores, see the video here.

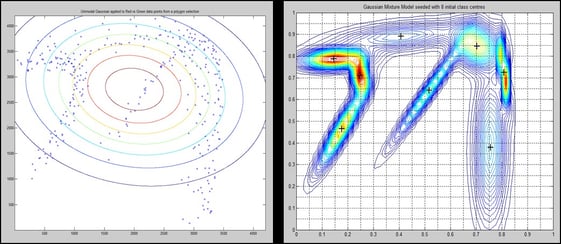
Instead of using simple contouring to describe a complex range of data (left), the IFC+ uses a Gaussian Mixture Model to detect trends in the data and assign best-fit class centres (right). This provides a more accurate reflection of the true facies being interpreted.
Facies tuning
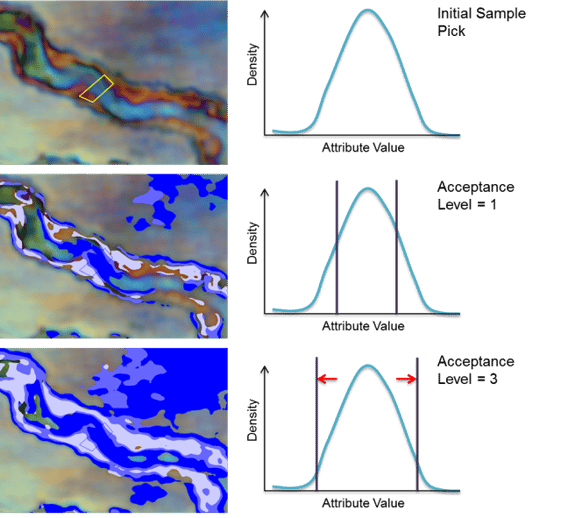
Tuning these facies and sub-facies is easy and the interpreter can use the immediate, interactive feedback to ensure they capture the heterogeneity of the features of interest perfectly. Adjusting the acceptance controls how similar or dissimilar the data ranges to be classified are. Changing the opacity lets the interpreter inspect the facies distribution with respect to the underlying seismic. Watch a short video on facies tuning here.
 Altering the acceptance level for a facies or set of sub-facies allows the interpreter to interactively decide what data ranges are appropriate for delineating the features of interest.
To evaluate and ground truth the interpreted facies classes, the Scatter Plot tool is used to compare attribute values against each other and well logs. While the facies themselves are picked from specific volume combinations, they can be scatter plotted for any dataset available in the project, for example a sample area picked using the geomorphology shown in an RGB blend can be used to compare Near and Far amplitudes for AVO analysis, to relate the qualitative and the quantitative. Sample areas picked from well markers can be used to compare seismic values with log values, directly relating the geology to geophysics and providing vital calibration for the modelling of facies. To learn how to Scatter Plot facies, click here.
Finally, once the facies classes are interpreted, tuned, and calibrated, they can be generated in seismic volume form with each class given a discrete value. These are then ready to be integrated back into the GeoTeric workflow, exported using the software links, or embedded directly into the reservoir model and populated with reservoir properties.

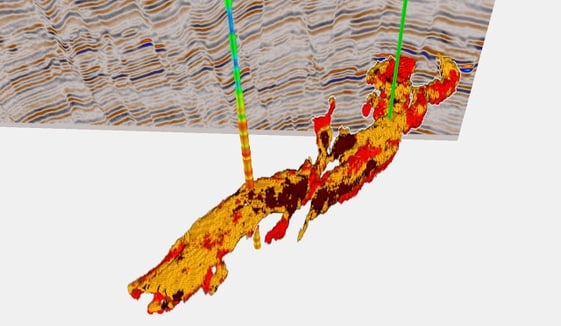
Finished facies model, displayed in 3D render mode, this volume can be used as part of a geologic modelling workflow.


