

As part of GeoTeric’s Data Conditioning workflow, the Spectral Expression Tool is used to shape your spectrum to increase the frequency content in your data in order to improve the vertical resolution of your data.
This is done by maximizing the bandwidth to produce a "white" spectrum, so all frequencies in the spectrum contribute equally to the power. With this enhanced spectrum imaging of faults, all scales are imaged better. Attribute extraction/analysis is improved and event thickness estimation is more accurate.
The Conditioned volume, which has been Noise Cancelled and Spectrally Enhanced, is the optimal volume to take forward into Frequency Decomposition and the Adaptive Interpretation.
Spectral Enhancement in GeoTeric can be run on either a Z-slice or a horizon. If you have a very structurally complex region, consider using a horizon, so not to include frequencies from different lithologies into your spectrum.
Figure 1 is the Spectral Expression tool using a Z-slice, the zone of interest is the red horizon. There is significant offset on the horizon of interest and using a 3.91Hz filter will not include all of the horizons in the spectrum generation.
When a lower frequency is used, 1.95Hz, to capture all of the zone of interest, other geology, such as the turbidite flows below the zones of interest are included in the spectrum generation, Figure 2.
If your area of interest contains a lot of changing geology, for example; from this sand/shale interval to the mass flow system. This will have an effect on your spectrum. To avoid including the response from differing lithologies, a horizon can be used to generate the spectrum for enhancement.
Since Spectral Enhancement is a interval focused process, using a horizon in this instance will allow you to use a slightly higher frequency around the horizon of interest to constrain the spectrum to your zone of interest. Figure 3 is the Spectral Enhancement tool generated along the horizon – the spectrum is more detailed and not as smooth as using the z-slices which incorporate a variety of geology.
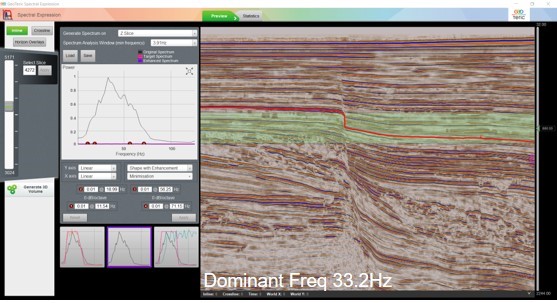
Figure 1: Zone of interest represented by the red horizon. Spectrum is generated from the green bar.
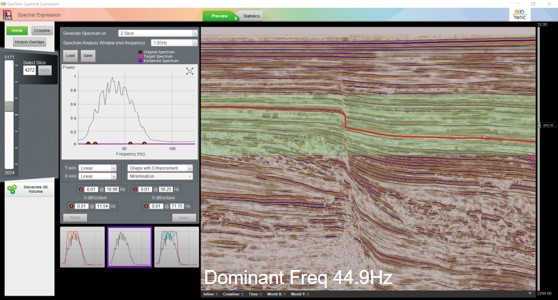
Figure 2: To incorporate the entire red horizon, a lower frequency needs to be used. This includes a variety of lithologies.
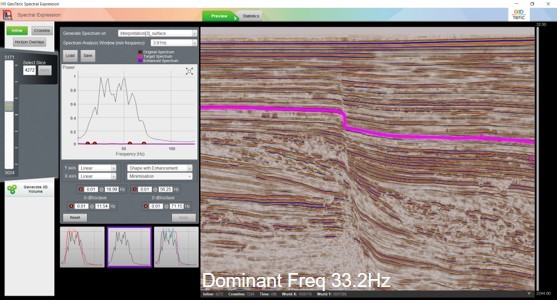
Figure 3: To avoid different lithologies in your spectrum generation, a horizon could be used to constrain the enhancement.
When carrying out spectral enhancement the objective is to create a flat spectrum on top of the spectrum. While enhancing your data, a few considerations should be kept in mind:
- The slope / taper of your filter - The abruptness of the taper is related to the resulting sidelobes in your wavelet. The more abrupt/steep your taper is, the more sidelobes you will have in your wavelet, potentially causing ringing in the volume. Figure 4 is an example of different tapers and the ringing evoked in the volume from the slope of the filter being sharp. The upper left figure is the Noise Cancelled volume that is the input to the Spectral Expression. The upper right figure is the outcome when your taper is very abrupt. Making the slope of your filter greater removes the ringing from the volume (bottom image in Figure 4).
- Introducing artificial frequencies into the data - These are frequencies that were removed during the initial processing or were never recorded. If you boost your spectrum too much on the high end, frequencies with no signal can be introduced into the data, which can cause ringing.
- Try to keep at least an octave or more between points 2 and 3 on the filter. A broader spectrum will result in a more compressed wavelet, ensuring that individual events are better resolved.
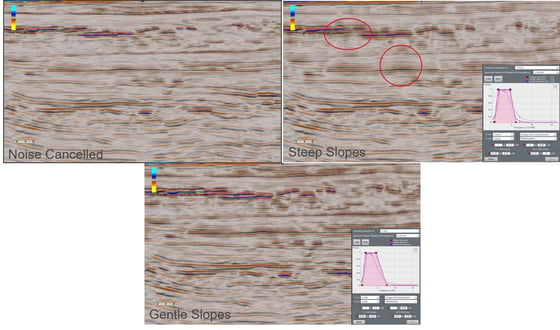
Figure 4: Noise cancelled volume on the top left, an Enhanced volume with steep slopes and ringing in the circles on the top right and an Enhanced volume with a gentle slope on the bottom.
Besides increasing the frequencies to help image thin beds, the higher frequencies can be removed to help image faults by filtering the data. Figure 5 is an example where the higher frequencies have been removed and the faults are better imaged to help with structural interpretation. Due to the lower frequencies of the events in this volume, it would be best not to use the stratigraphic interpretation, as the faulting is much clearer.
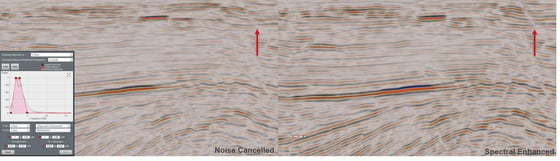
Figure 5: On the left is the Noise Cancelled volume, and on the right, the high frequencies are suppressed. Faults indicated by red arrow more apparent in the bandlimited volume.
When determining what type and how much enhancement of a volume you should be doing, it is advised to carefully QC the enhanced result - to ensure that the result is boosting the geological meaningful signal and not introducing artificial events, such as ringing.
A good way to QC the enhancement is by extracting a wavelet over the zone of interest from the enhanced volume and tie it to your well data.
Further detailed description of the Spectral Expression tool can be found in this two-part blog post, Part 1 and Part 2.
There are other options to enhance your data set, one being Differential. See this post for further hints and tips.
