

GeoTeric 2018.1.2 introduced the ability to create a wedge model in Validate to estimate thickness from the RGB blends. Frequency responds to changes in lithology, which can be modelled using the Validate Layer Model, but also to changes in thickness. By creating wedge models, interpreters are now able to model thickness changes in an interval and determine which colours represent different thicknesses.
There are two types of wedge models available - a simple wedge model, placed anywhere on a volume slice or arbitrary line or using a wedge created from specified well markers.
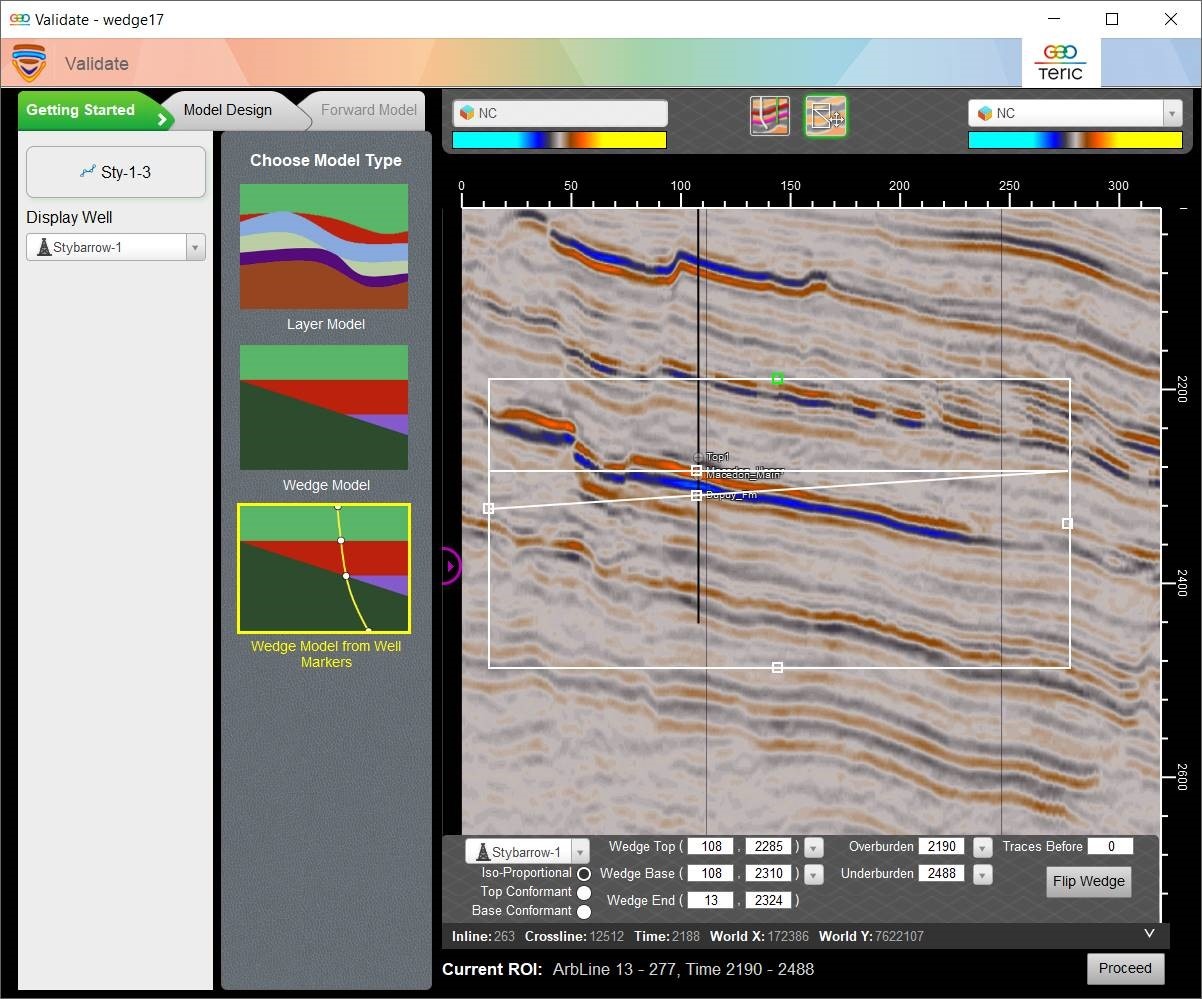 Figure 1: Validate Wedge Model Getting Started interface
With a simple wedge, select the slice of interest and move the wedge to desired location in the slice. The Wedge Top, Base and Wedge End locations can be set with a time value or the squares can be pulled into location. All aspects of the wedge geometry can be altered and tailored to specific requirements. Wells can be displayed for location accuracy. If building a Wedge from Well Markers, all of the wedge points can be tied to Well Markers which have be pre-defined within the GeoTeric project.
Model Design
As with the Layer Model, Wedges can be populated with rock properties in several different ways. Rocks can be created, by entering in Vp, Vs and Density values from analogues in the area you are modeling. If you have wells, you can create Rocks with average log properties between specified markers or depth locations.
Forward Modelling
As with the Layer Models, wavelets can be extracted, imported or a Ricker wavelet can be used to create the synthetic model. Wiggles can be added to the wedge to gain a better understanding of where the wedge pinches out and tuning occurs.
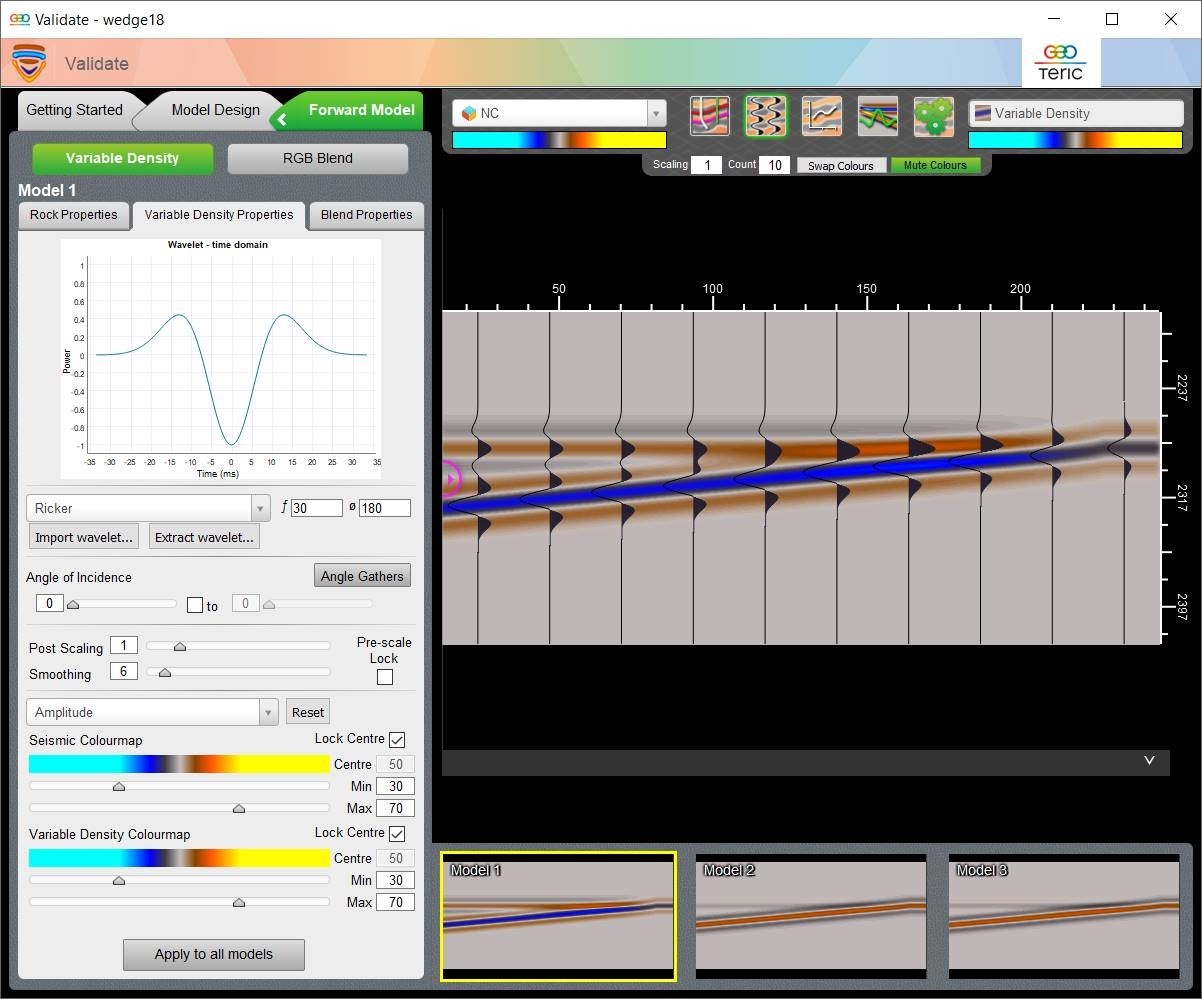 Figure 2: Forward Modelling Tab - variable density
To determine the thickness of your wedge at tuning, a Tuning Graph and Wedge Thickness can be turned on, see Figure 3. This allows the interpreter to understand the thickness at which tuning occurs when viewing the Variable Density model. The green line below the thickness graph illustrates the amplitude along the green line which should be positioned at the top of the wedge. Where the graph is at the maximum amplitude, this would be considered tuning.
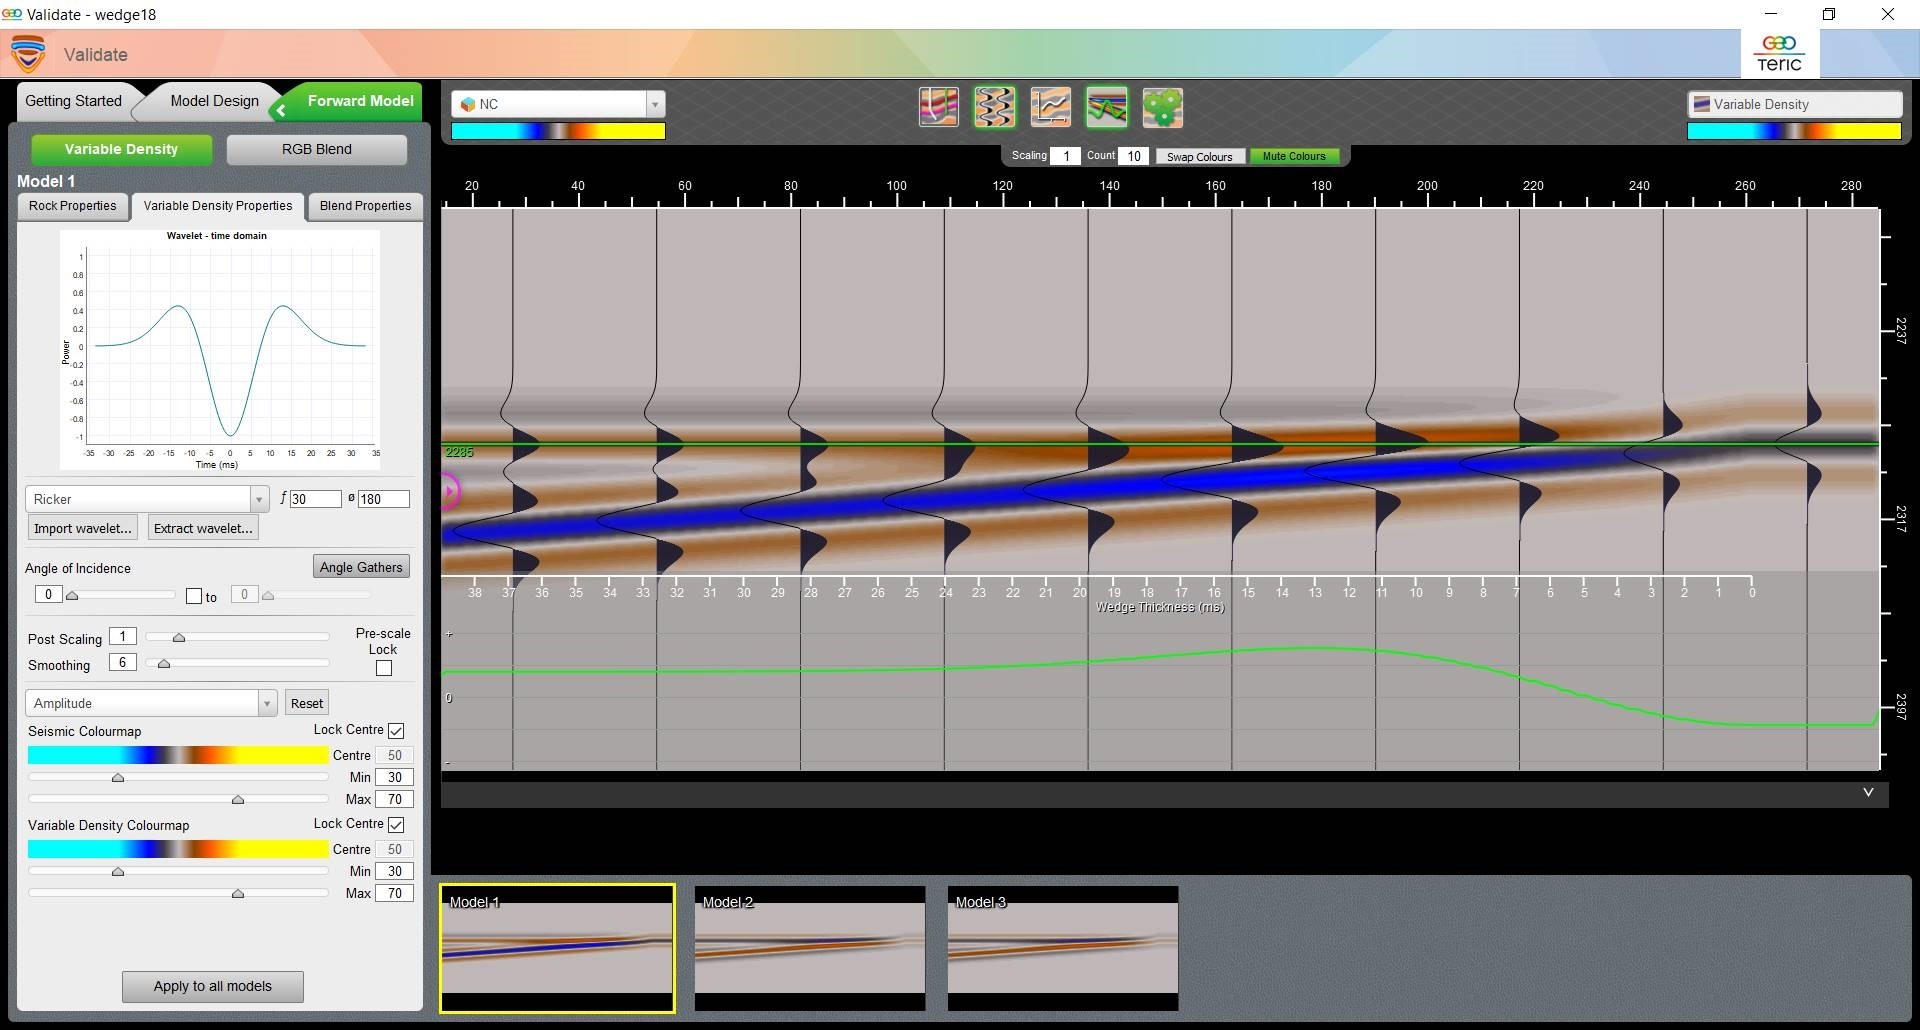 Figure 3: Synthetic Variable Density Wedge model with wiggles overlaid and tuning graph
Once the synthetic variable density model is created, the RGB blend properties can be applied to the wedge (Figure 4). Applying the RGB blend to the wedge model will correlate the thickness to the colours in the blends. The RGB blend properties from the project can be applied to the synthetic wedge model. The wedge model will now have the same frequency parameters as the project blend.
The interpreter has the ability to create several different wedge models, the thickness of the wedge will stay the same, but by varying the properties, different colour variations can be achieved. Changing the fluid content of the middle layer will also affect the RGB response of the wedge. This will help with understanding reservoir thickness and relating the colours in the blend with thicker or thinner deposits.
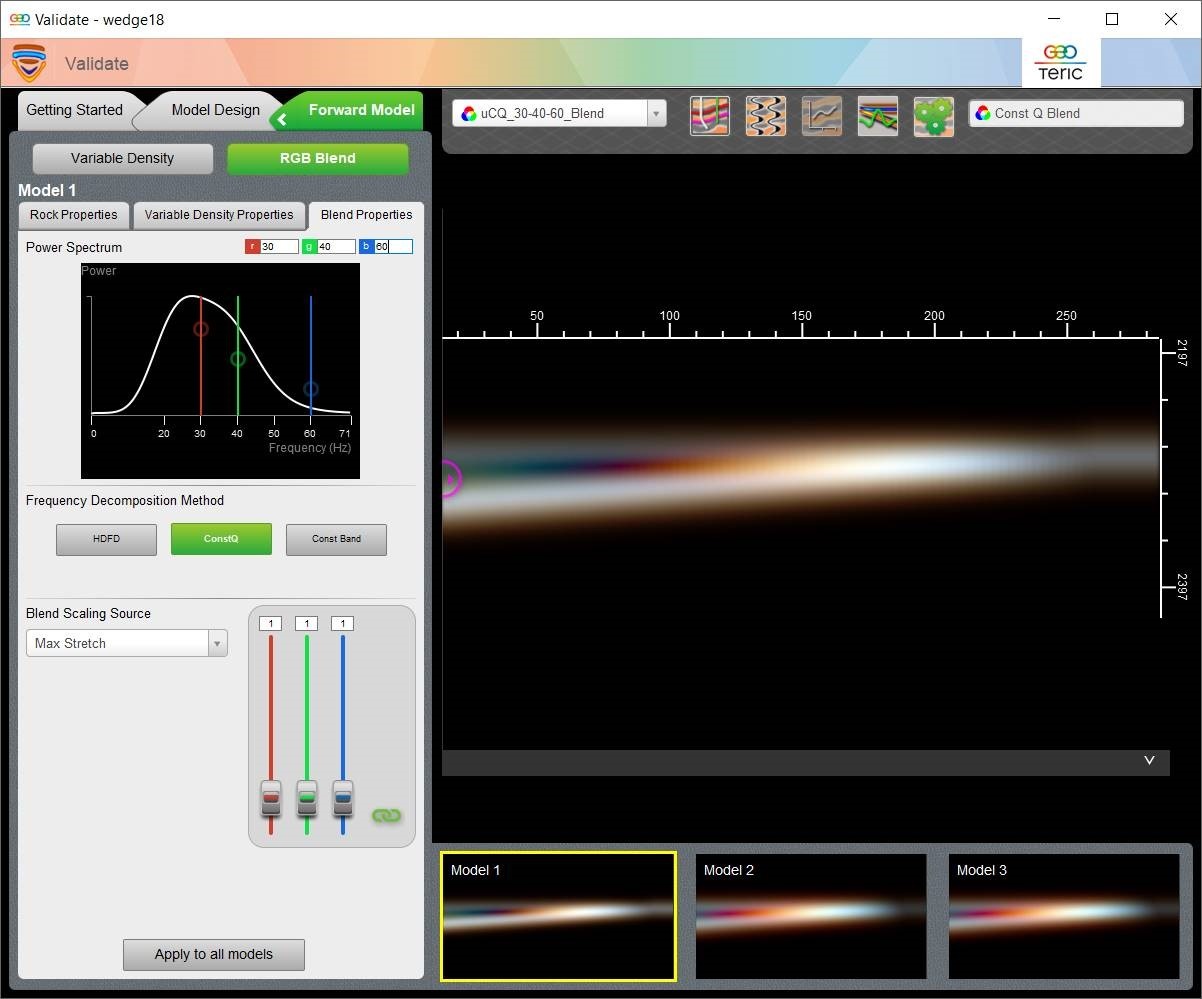 Figure 4: Frequency RGB blend of Wedge with different rock property options below the Wedge
