

Decomposition on depth data is largely equivalent to that of time data as it is carried out on a trace composed of discrete samples. The resulting frequency units is cycles/samples for both, which in turn equates to cycles/second (Hz) for time data and cycles/m (we use km in order to get nicer numbers to work with) for depth data.
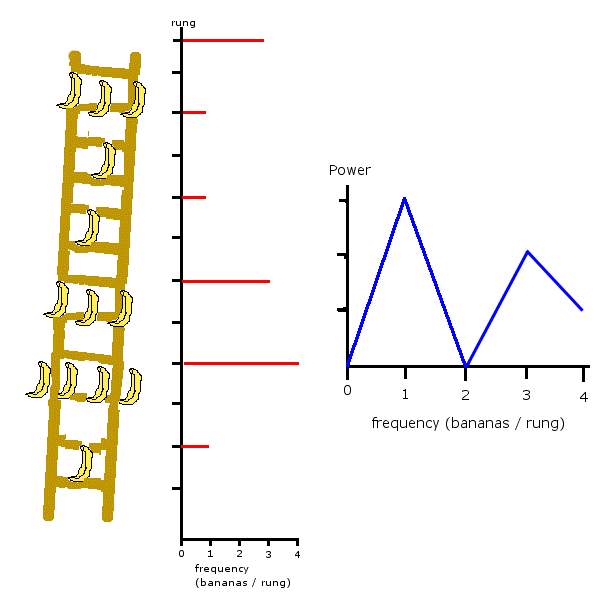
Frequency is just measuring rate of occurrence; that is the number of occurrences/events/peaks_and_troughs within a period and the period may have any unit.
Please consider the following:
Although the decomposition itself is equivalent, the frequency spectra of time and depth volumes will differ as there is a non-linear relationship of velocity between the two. The frequency of depth data reduces with depth much more than with time data, because it’s a function of the increasing velocity with depth, as well as the regular attenuation of high frequencies in shallow sections.
It tends to be that the shape of the spectra generated for time and depth data is very similar however the peak frequencies will differ. Consider the following:
Time data with sample rate of 4ms.
Depth data with sample rate of 5m and an average velocity of 2.1kms-1
The spectrum for the time cube is generated over a window of 64x4ms=256ms, whereas the depth spectrum window is 64x5m = 320m, which when converted to time using the average velocity, the depth spectrum window = 156ms. In this example the depth spectrum is sampled on less ‘real geology’ than the equivalent in time, which may produce a
different result unless it is laterally
and vertically very uniform.
