GeoTeric projects can benefit from additional information in the form of property maps, such as CSEM resistivity, porosity, net pay or water saturation to name but a few.
The horizon file needs to be conditioned and then imported using one of the “ffA ASCII Horizon File” formats, either as world coordinates or seismic survey grid. It is recommended to do this in excel, or a text editing application that supports column editing. You can also export a horizon from GeoTeric in the above format, then copy and paste the headers that are generated.
- Start with a simple ‘IL XL X Y Z’ column format
- Add 22 header lines that all begin with a hash (#) symbol, either manually or by copying and pasting from the example file here
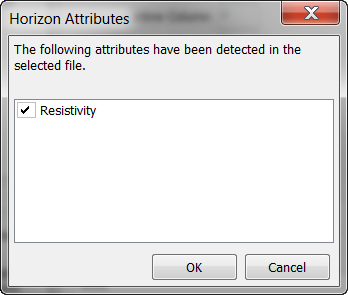
- Ensure that line #22 contains the column labels, e.g. ‘Inline Crossline X Y Time Resistivity’. Please note that these labels must be TAB separated for GeoTeric to detect them. If detected, a window like this will appear when you click import:
- The data columns should begin immediately below, also TAB separated.
- Remove any footer lines that may be present.
Points to note:
- GeoTeric uses positive depth/time values
- Remember to apply the correct Z sampling during import, e.g. seconds or milliseconds
- GeoTeric horizon attributes must be integer values, so it is recommended to multiply any floating point values by a scalar to avoid loss of resolution. For example, if a typical value is 1.23, multiplying all values in that column by a factor of 100 will result in that value becoming 123.00 and no data will be clipped or aliased.
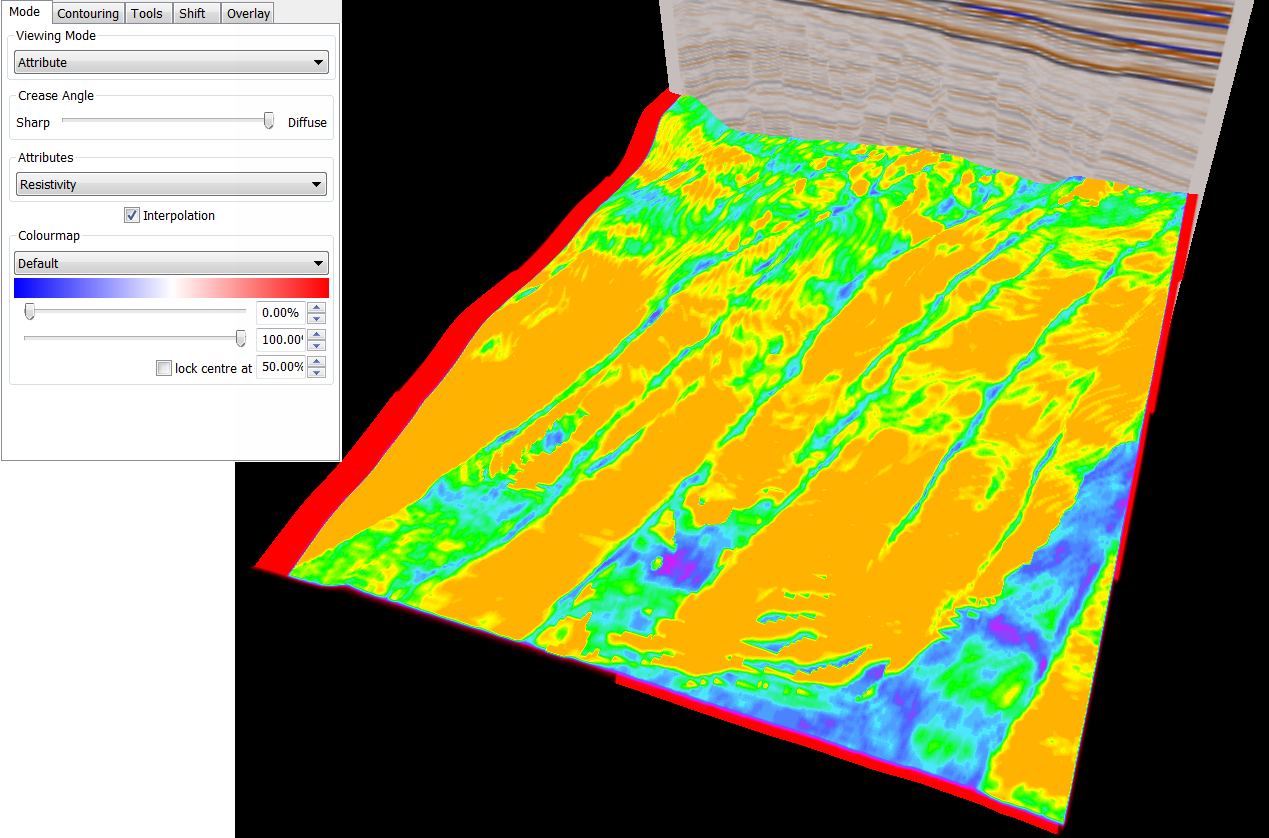
Once the horizon is loaded, select ‘Attribute’ from the ‘Viewing Mode’ dropdown in the horizon properties panel, then select your attribute or imported property from the new dropdown which will appear. After that, all you need to do is choose and align your preferred color map to visualize the results.