

|
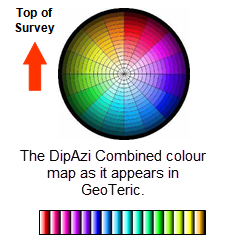
As we have seen in previous blog posts (Seismic Interpretation and Colour) the choice of colour map is very important to how the data is presented and interpreted. In GeoTeric we have some customised colour maps to optimise the display of some of
the attributes in the application e.g the DipAzimuth Combined attribute.
However, it's also very easy to create your own colour maps and have these added into the application and below are some simple steps on how to do that. GeoTeric will load any valid colour map which it finds in the installation directory when starting. A custom colour map can be added by creating a new file with a .cmp file extension. The format of a .cmp file is defined in xml and can be written in windows notepad or any other text editor of choice.
|
A colour map is defined as:
- A <colourmap name=””></colourmap> tag, containing
- At least one <range width =””></range> tag, containing:
- At least two <point></point> tags.
- A <complement> tag follows the <colourmap> tag. This can be ignored when building simple colourmaps.
- There is no interpolation between ranges.
- All the widthattributes of any ranges must add up to 100%
- Each <point></point> tag must enclose three decimal values.
- These values are interpreted as Red Green Blue and are in the range of 0.0 to 1.0.
- The first and last points in the range are aligned at the edges of that range.
- Any other pointsare equally spaced along the width of the range.
- HTML style comment tags can be added to the files e.g. <!— comment -->
The following is an example of a colour map with a single range:

|
|||
An example with Multiple Ranges:

|
<colourmap name="BodySpectrum">
<range width="1%">
<point>
0.0 0.0 0.0
</point>
<point>
0.0 0.0 0.0
</point>
</range>
<range width="99%">
<point>
0.0 0.0 1.0
</point>
<point>
0.0 1.0 1.0
</point>
<point>
0.0 1.0 0.0
</point>
<point>
1.0 0.0 0.0
</point>
</range>
</colourmap>
|
This colour map has multiple ranges and is similar to the BodySpectrum colour map provided with GeoTeric.
This colour map has two ranges.
The first range is fixed at 1% of the total colour map range and contains two points. Both points as black so this whole range will appear as black.
The second range covers the rest of the colour map’s width. There are three points:
Point (1) is blue
Point (2) is cyan
Point (3) is green
Point (4) is red |
To see more examples, open any of the .cmp files within the GeoTeric installation folder.
Finally, the blog will take a break over Christmas and New Year period - we will be back in January with more hints and tips as well as software updates.
Here's to a Merry Christmas and Happy New Year!
