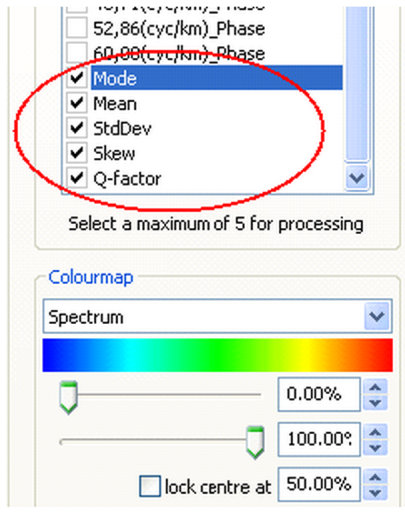
The Frequency Decomposition workflow tool produces bandpass, magnitude and phase data over the frequency range selected by the user. It also produces a number of statistical Spectral Attribute measurements on the distribution of signal energy in the spectrum over that same user selected range. The first three attributes are first and second order statistical measures:
- Mode
- Mean
- Standard Deviation
These attributes all have the units of frequency, are always positive and their relationship to the spectrum is illustrated below.
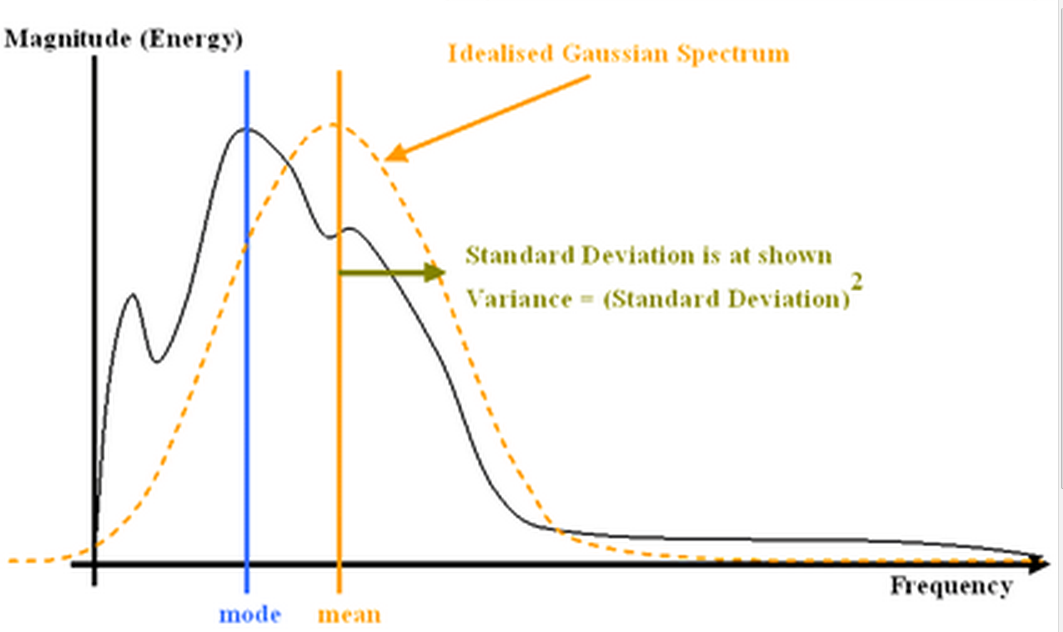
Standard Deviation can be related to the bandwidth of the spectrum, where bandwidth (measured at -4.3dB) = 6 * Standard Deviation.
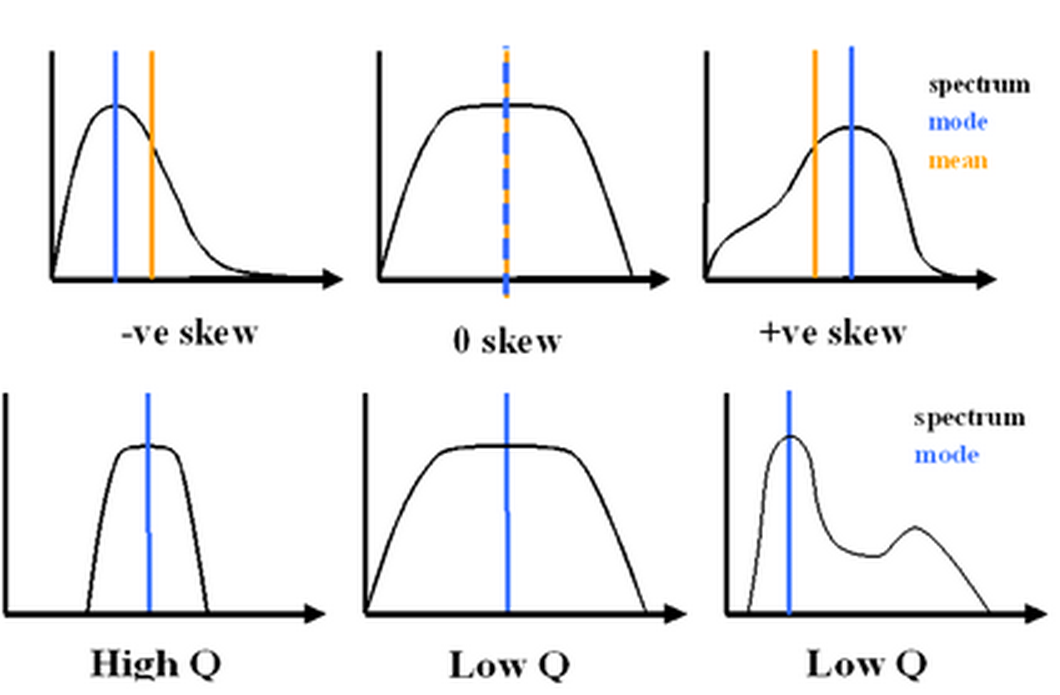
Skew is a unit less 3rd order statistical measure that can have positive or negative values and that reflects the skew within the frequency spectrum as illustrated.
Q-factor is a unitless measure of the shape of the spectrum and is related to bandwidth, as illustrated.
Local narrowband, single mode spectra have energy concentrated in few frequencies and are high Q.
Wideband and multimodal spectra are low Q.