

This week’s blog post focuses on one attribute - Standard Deviation. This can be generated in GeoTeric, using the Batch processing tool in the Stratigraphic Attributes section.
It is a multi-trace based attribute that calculates the standard deviation over a user defined 3D neighbourhood around each point in the data. The neighbourhood used is specified by the user in the UI by changing the x,y and z sliders. Standard Deviation is a measure of variability, measuring the local variability in the data. It can be used both on reflectivity data as well as other attributes.
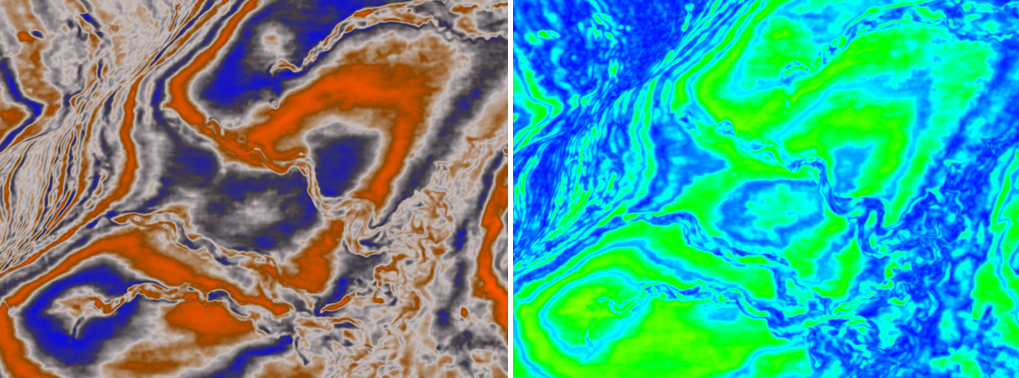
Noise Cancelled volume (left) and StdDev (3x3x3) (right) highlights abrupt amplitude changes in the raw seismic data
If we instead run it on an Envelope volume, it will produce a result completely independent of phase where we can analyse true amplitude variations. Using the spectrum colour bar, high values (greens to reds) highlight the point of greatest change. In the example below the greatest point of change observed in the StdDev is at the channel edges. There are also additional variations highlighted in the channel infill, yet this is a continuous amplitude value in the envelope volume.
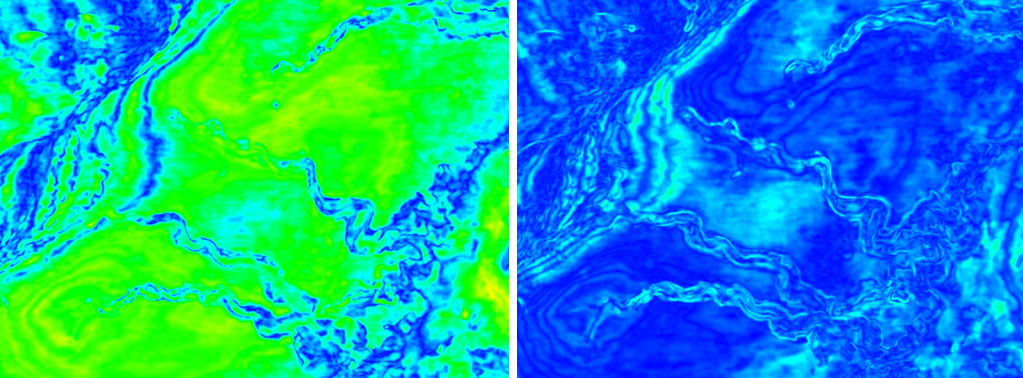
Envelope volume (left) and StdDev (3x3x3) (right) calculated from the Envelope.
The below example calculates StdDev (3x3x3) on the three frequency magnitude volumes that were output from the Frequency Decomposition Tool forming the RGB blend. The RGB blend highlights subtle variations in amplitude magnitude at specific frequencies. In the StdDev blend there is less internal characterisation of the channel fill, but there is greater definition of the channel edges and the sinuosity that characterises the morphologies of these channels.
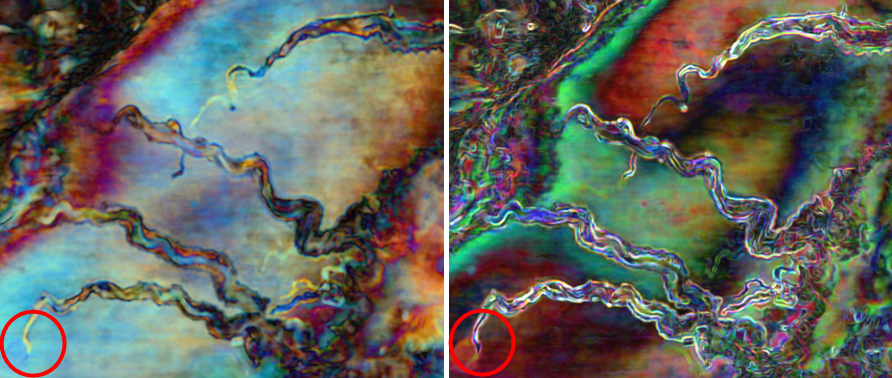
RGB Blend of 3 frequency magnitude volumes (left) in comparison with a RGB blend of the StdDev volumes run on the original magnitude volumes (right).
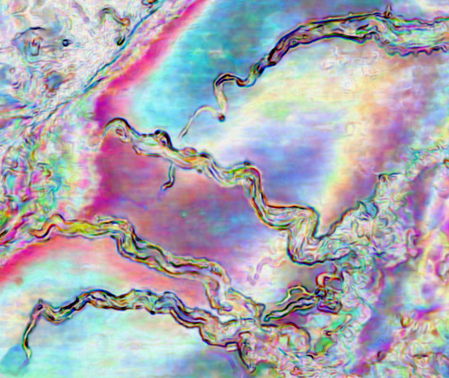
Combining the three StdDev volumes as a CMY blend, better represents the channel edges where all three volumes contribute (black lines). This increases confidence and strength of the channel edge visualisation which helps to better image smaller channel features.
In summary, StdDev is not restricted to amplitude variations. As a trace based attribute, it will calculate the Standard Deviation of any value present within the input, whether this be amplitude, phase or frequency. As a mathematical attribute it can offer additional ways to analyse attribute values within your data and calculate the greatest areas of change.
