

This case study was performed using the Snark3D dataset which covers part of the Barrow sub basin in the North West shelf of Australia. The target comprises Lower Cretaceous Barrow Group fluvio-deltaic deposits, in particular submarine canyon turbidite sands which have good reservoir potential and which have been regularly compartmentalised by NW-SE faulting, possibly slump related. These canyon deposits underlie the slightly later Barrow Group submarine fans which make up a separate group of plays and mark a different episode of the marine-transgressive sequence.
The aim of the study was to run an automated fault analysis on the lower Cretaceous sands, using volumes with different noise attenuation levels to identify the effect the noise attenuation has on edge attributes.
Noise Attenuation
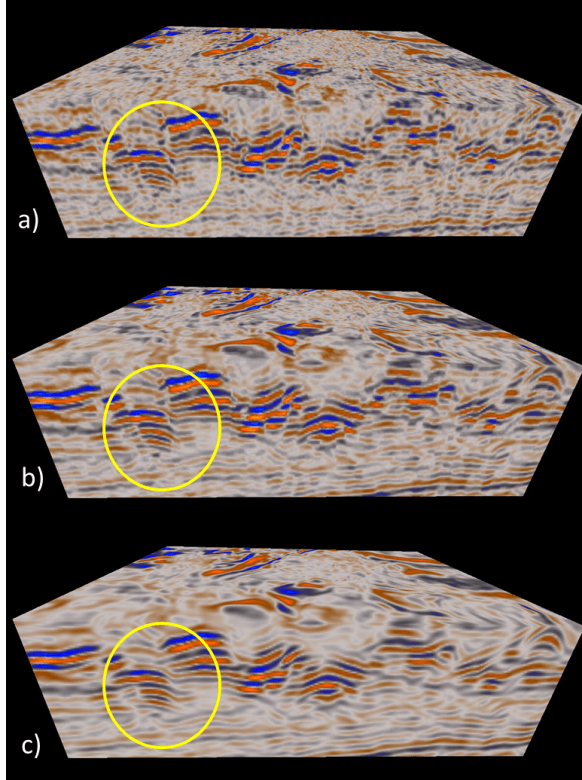
Two noise attenuation algorithms were applied to the data, the SO Mean filter and the SO FMH filter. Both filters used the same filter size and the same dip and azimuth steering volumes. Figure 1 shows the effect of the different filters on the reflectivity data. The SO FMH filter has attenuated the noise and preserved the sharp breaks that are indicative of faults (yellow circles). The SO Mean has been more aggressive and shows a greater level of continuity along the reflectors, but the faults have become smeared and the edges are no longer sharply defined.
 |
|
Figure 1
The effect of noise attenuation on the reflectivity data. a) Original reflectivity, b) after SO FMH filtering, c) after SO Mean filtering
|
Dip analysis
Measuring the orientation of the reflectors and viewing the instantaneous dip is an effective way of highlighting faults and can be relatively insensitive to noise. However significant noise, as is present in this data set, can have a detrimental effect on the clarity of the dip volume as is seen in Figure 2. When run on the original data, very few coherent lineations are visible and the image is dominated by clutter caused by the noise. When run on the SO FMH data the resulting dip information is much clearer, coherent lineations are visible both on the time slice and the vertical section, and trends of faulting become apparent. The cleanest image is achieved by running the algorithm on the SO Mean filtered data. However in this volume the faults are less clear and in some places appear fuzzy or are absent completely, as this is due to the attenuation of the fault expression in the seismic data.
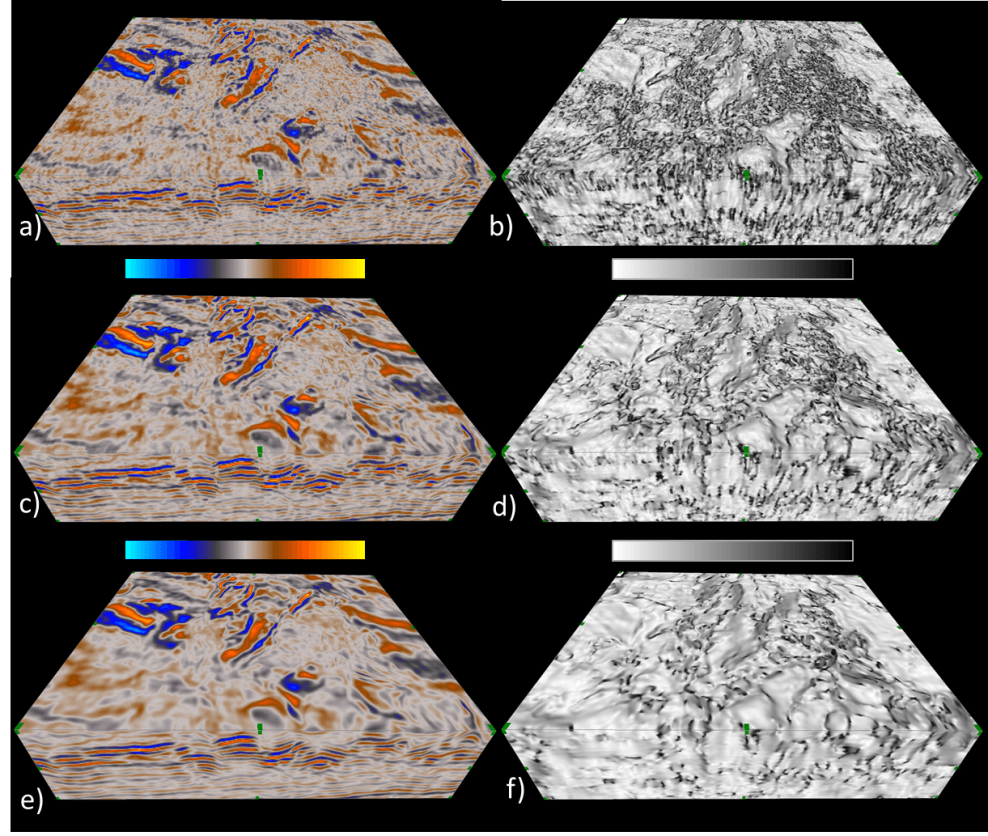 |
| Figure 2 The effect of noise attenuation on the subsequent Dip analysis. a) Original reflectivity, b) Dip volume calculated on the original data, c) SO FMH volume, d) Dip volume calculated on the SO FMH data, e) SO Mean volume, f) Dip volume calculated on the SO Mean volume. |
SO Semblance
Structurally oriented semblance is form of coherency or cross correlation and is effective at highlighting discontinuities in the data, especially those represented by a phase break. It is reasonably independent of amplitude so can be very effective at highlighting faults in low amplitude regions. The results in Figure 3 show how the noise attenuation results in a much clearer image of the faults, especially the main bounding faults which compartmentalize the channel system. The low amplitude, chaotic zone immediate above the channels appears as a dark and incoherent zone when the SO Semblance is run on the original data. However when the algorithm is run on the noise attenuated data, coherent lineations within that zone start to become apparent, and the stronger the noise attenuation the clearer these lineations become. The SO Semblance when run on the SO Mean volume does not appear to have the same level of fault deterioration as we saw in the Dip volume. This suggests that the SOS Semblance is a more sensitive measure of fault discontinuities than the Dip and can still highlight faults even if their expression has been degraded, or was less apparent to begin with.
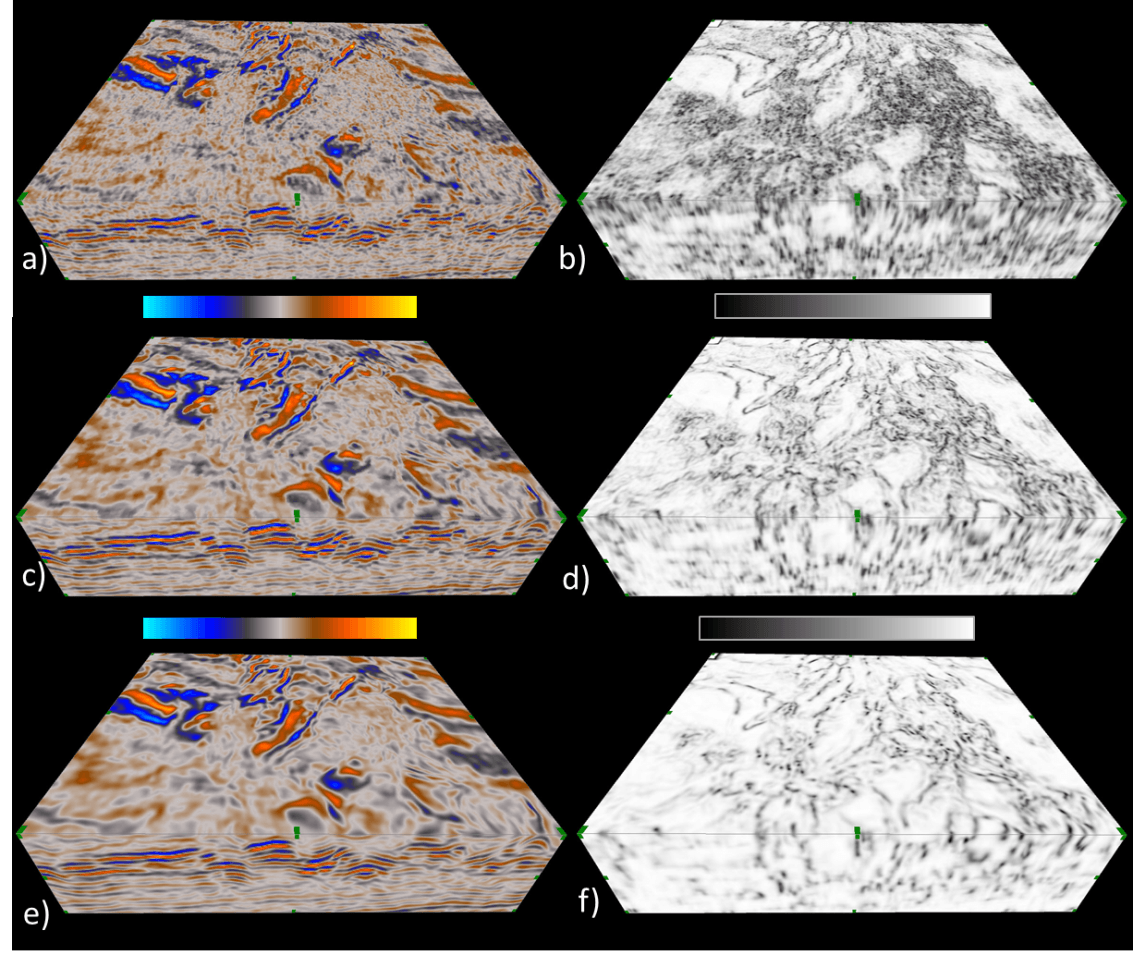 |
| Figure 3 The effect of noise attenuation on the subsequent SO Semblance analysis. a) Original reflectivity, b) SO Semblance volume calculated on the original data, c) SO FMH volume, d) SO Semblance volume calculated on the SO FMH data, e) SO Mean volume, f) SO Semblance volume calculated on the SO Mean volume. |
This study on data from the NW Shelf, Australia is supported by data from a number of other locations around the world and from both onshore and offshore locations. In almost all instances it was found that noise attenuation improves the accuracy and the clarity of the results that are obtained from the data. Different attributes respond in different ways to the fault expression, and therefore some attributes appear to be better at highlighting subtle fault expressions in the data. This data has shown that if aggressive noise attenuation is desirable, then using the SO Semblance attribute for subsequent faults analysis is more effective than using the Dip attribute.
