

The thin bed workflow aims to identify events that are approaching the limit of seismic resolution, generally considered to be about a quarter of the dominant wavelength. The workflow looks at techniques which identify very subtle changes in the wavelet to reveal information about events that are poorly resolved in the seismic data.
Two different approaches can be used for thin bed identification; frequency or phase based techniques. The frequency based methods include Spectral Enhancement, Frequency Decomposition and Instantaneous Frequency. The Phase based methods, which will be covered in part II, include Bedform Indicator and Terrace attribute.
Spectral Enhancement
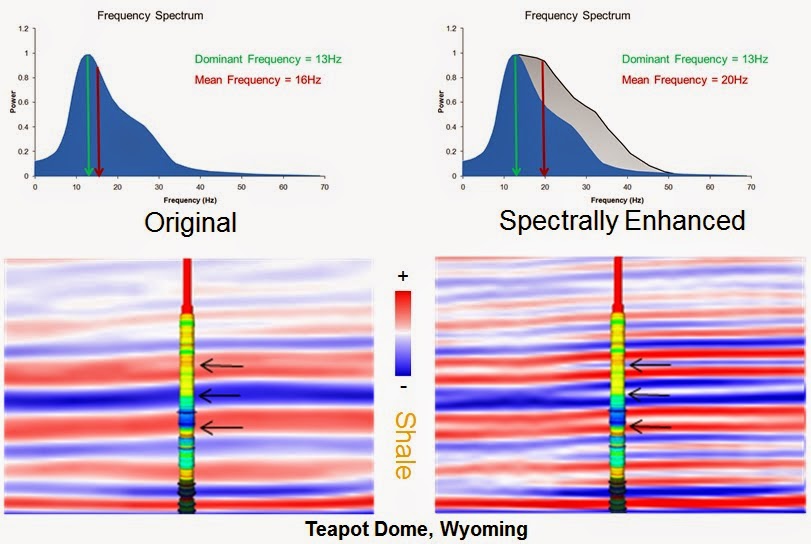
Spectral Enhancement is a technique for selectively boosting portions of the seismic signal with distinguishable frequency content. It is often applied to seismic data in order to maximise the bandwidth of the data and increase the mean frequency, leading to a better
vertical resolution and improved interpretability.
As shown in the image, Spectral Enhancement can be used to increase the contribution of the high frequencies and potentially archive a better correlation with the well data. This workflow can be accessed from the shortcut icons in the main GeoTeric window or from the workflows menu.
Frequency Decomposition
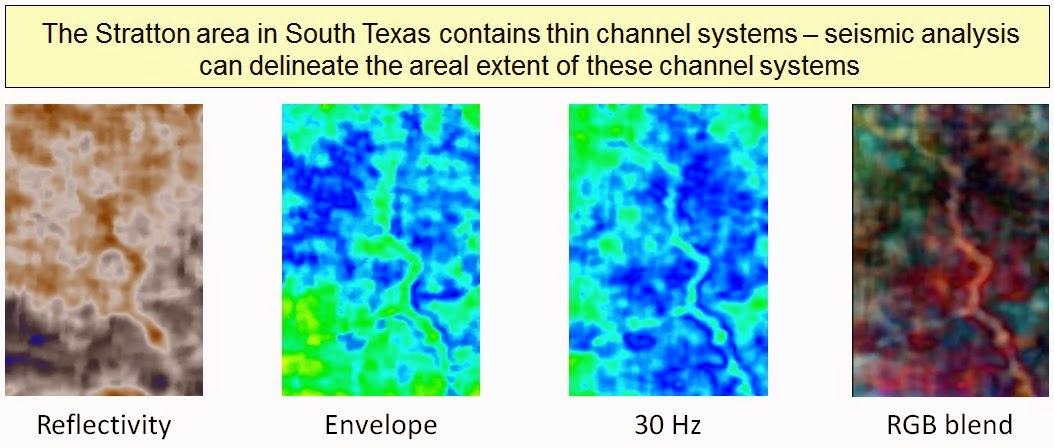
The image shows an example taken from the Stratton area in South Texas which contains a number of very thin channel systems which are poorly resolved in the reflectivity data. In the original data we can see some indication of a channel trending down through the middle of the image. If we look at the full frequency envelope response we get a bit more definition of the channel but we can see it is difficult to differentiate it from the stratigraphy in the bottom left hand corner, but when we extract a band limited response centred on 30 Hz the channel is clearly defined and it no longer blends in with the surrounding stratigraphy.
However, in many cases one frequency band will not describe the full geological feature. Combining frequency magnitude responses together allows changes along the channel to be identified by co-visualising three frequency magnitude responses simultaneously using a Red-Green-Blue colour bar.
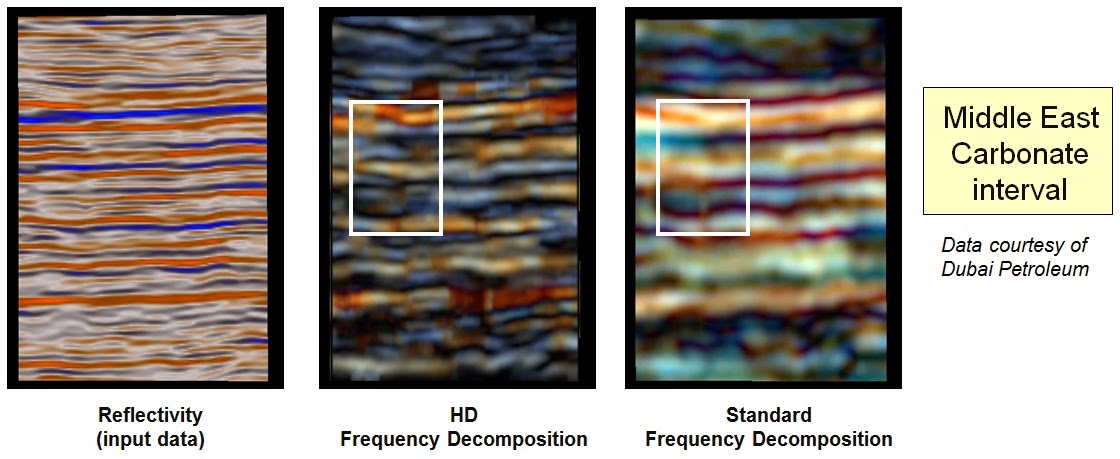
The three Frequency Decomposition methods available in GeoTeric can be divided into two categories; standard and High Definition. The standard methods are conventional decomposition with a sliding window, to include, Constant Bandwidth and Constant Q methods. High Definition Frequency Decomposition (HDFD), on the other hand, is based on a matching pursuit algorithm, which is essentially retaining the vertical resolution of your original seismic.
If we are looking to differentiate different layers in a stacked channel system, vertical positioning is quite important so it is advised to use either Constant Q or HD FD methods.
Instantaneous Frequency
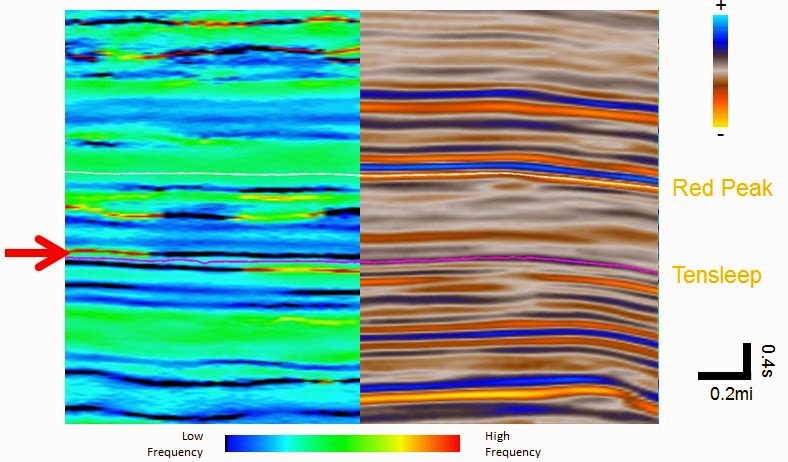
Instantaneous Frequency can be used as a discriminator of depositional characteristics - at small scale (high frequencies) it indicates sharp interfaces and at large scale, anomalies can indicate unconsolidated sands within gross bedding geometries.
This attribute is also useful at identifying areas where doublets might be present in the traces, as in these situations the Instantaneous Frequency attribute will have negative values (black colour in the picture below). This allows the interpreter to easily identify areas where reflectors might look like they are pinching out at the first look, but in fact they might not be if a thin bed is present.
The Instantaneous Frequency attribute is available in the Processes & Workflows menu -> Processes -> Attributes -> Trace attributes -> Attributes.
Coming soon - Thin Bed Workflow: Part II Phase Based Analysis
