In part 1 of this blog post we established that Spectral Expression relies on two key concepts
- being able to automatically determine the optimal number of frequencies- see here.
- capability to determine the frequency weights required to shape the data to a target spectrum- which we will cover in this blog post.
Spectral Shaping
The spectral shaping occurs by determining the optimal combination of weights that minimises the area (grey) between the shaped spectrum (orange curve) and a target function (yellow curve) see below.
|
| Showing original spectrum (blue), target spectrum (yellow) and shaped spectrum (orange) |
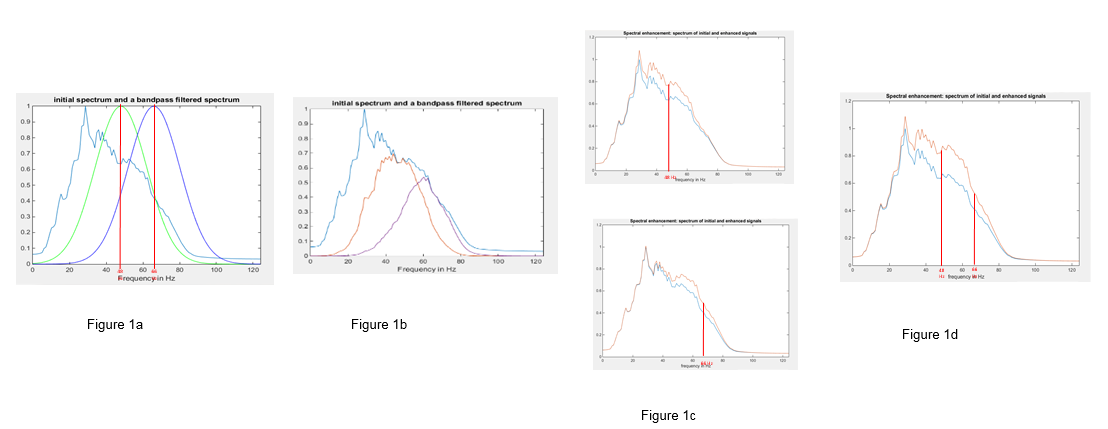
A minimisation algorithm is required to determine the optimum frequency weights due to the overlap between frequencies. If the weights of two frequencies are boosted, the common area under the bandpass curves will in effect be boosted twice. This can be seen in the figure below.
The minimisation algorithm is used with a combination of positive or negative weights in order to compensate for the boosting effect of intersecting frequencies while moving closer to the target spectrum.
Figure 1a above shows an example intersection between two frequencies (48Hz and 66Hz). Figure 1b shows the resultant bandpass filtered spectrum for the two frequencies. Figure 1c shows the effect of boosting both dominate frequencies by a factor of 0.2. Figure 1d demonstrates the compounding effect of adding two difference between the original spectrum and the boasted spectrum.