

The study area is located in the Gulf Of Mexico and in this particular area, there is a strong lateral variation in amplitude. Numerous Gas Chimneys are visible in the reflectivity data, but we would like to push the study further by being able to accurately differentiate the Gas Chimney’s stratigraphy from the surrounding stratigraphy.
To achieve this, we have applied GeoTeric’s Interactive Facies Classification tool which offers the interpreter an advanced method of Seismic Facies classification in a rich multi-attribute environment.
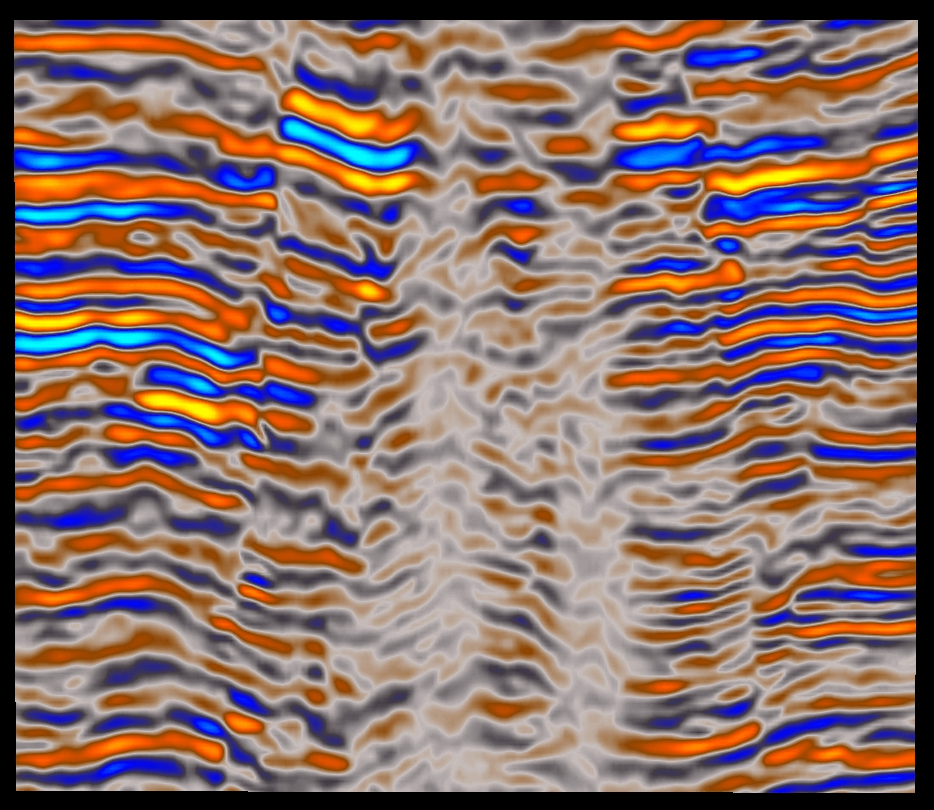 |
| Original input |
IFC+ utilises a
sophisticated attribute distribution model (read here for details) which detects subtle trends in order to differentiate classes. IFC+ combines the power of interactive data-driven, interpreter guided classification with the ability to clearly visualise the key geology using GeoTeric’s RGB blending techniques.
The first step was to launch the IFC+ tool and interactively define different class sample areas in order to create facies based on different seismic characteristics. In this study we have chosen the Envelope attribute and a Colour Blend made up of three magnitude volumes (low, mid and high frequency).
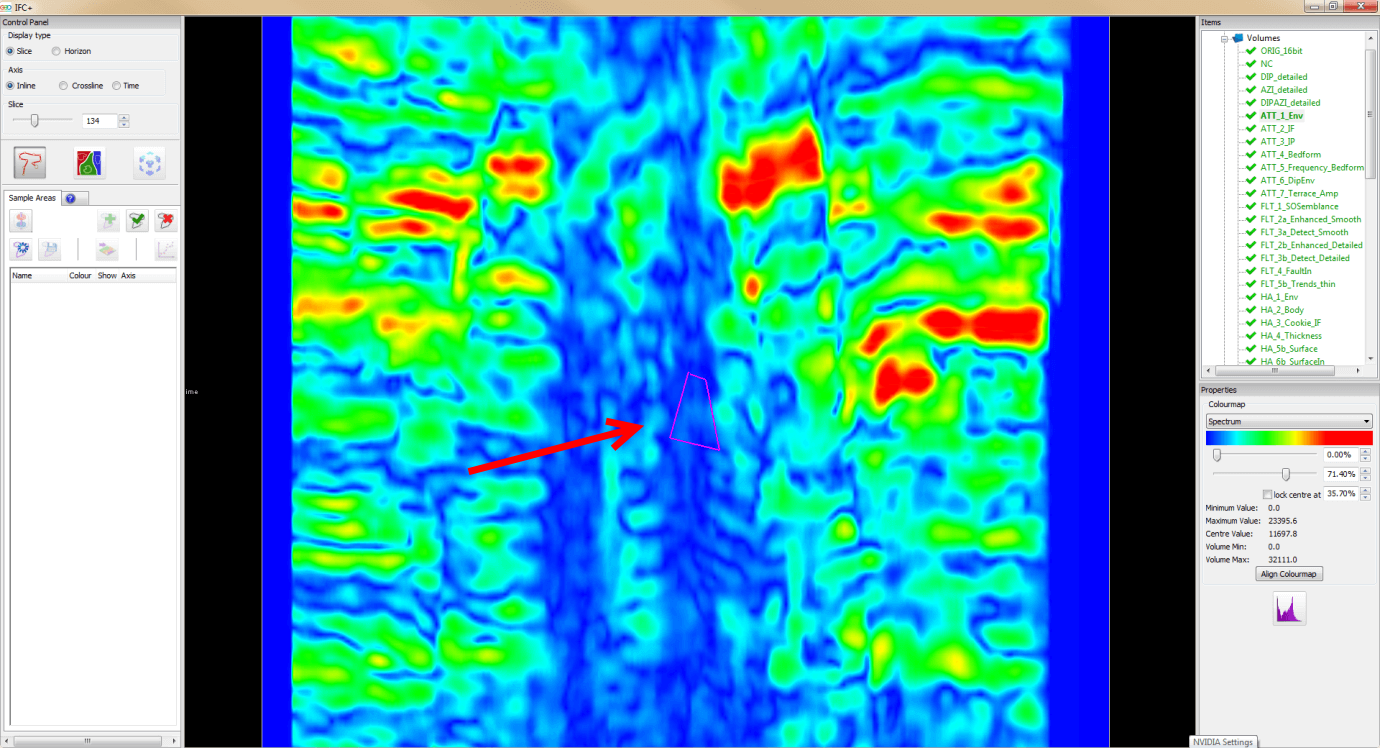 |
| The envelope attribute loaded in GeoTeric's IFC+ with the defined sample area drawn. |
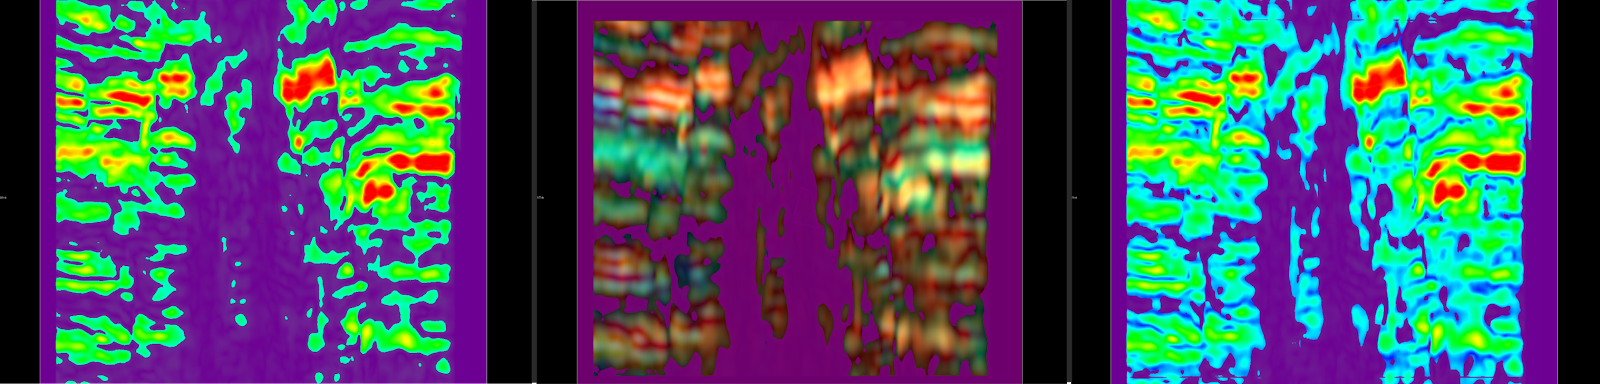 |
| Results from the IFC+ classification based on sample area defined above. Left to right: result on a single envelope attribute, result on a blend and finally the classification result using both blend and envelope attribute as input for the classification. |
As we can see, by selecting 4 attributes to define the facies classification, we now have more localisation of our Gas Chimney feature (shown in the purple facies). Using these multiple attributes has altered the distribution of the purple facies by constraining the classification so that this class is more localised and better represents our feature of interest.
After having computed the facies within GeoTeric, we can now view these in 3D. The results below show you the different representations of facies models using 3 methods of classification.
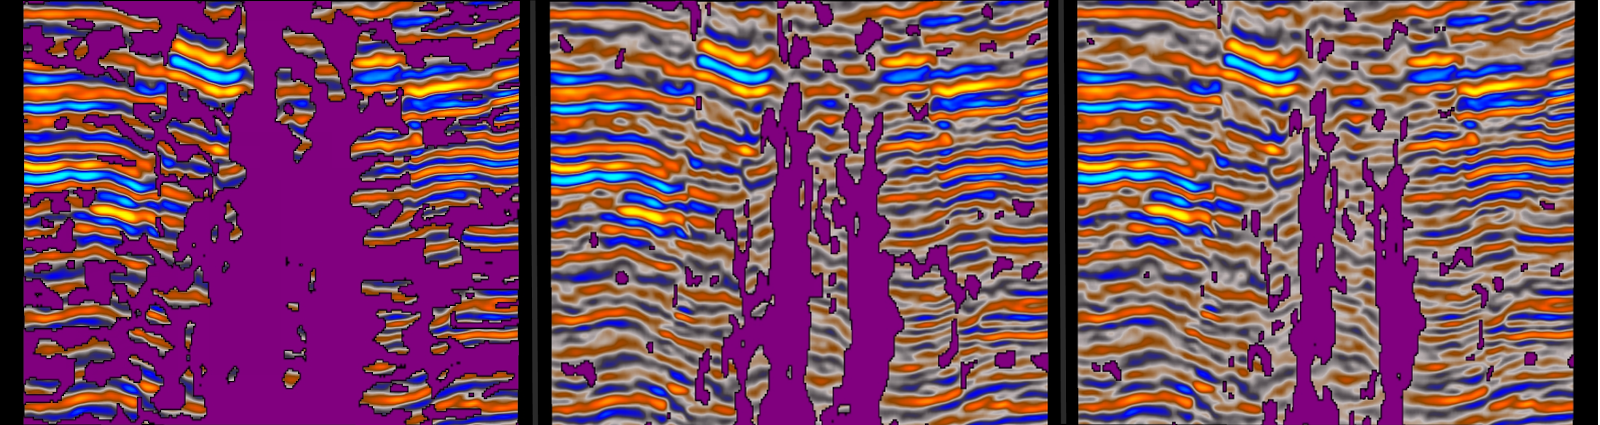 |
| IFC+ classification results inlaid on original input data. From left to right: classification result based on a single attribute, classification result on a colour blend (based on 3 attributes) and classification result based on 4 attributes (1 envelope and 3 Magnitude) |
Below is 3D representation of the Gas Chimney feature with the seismic in the background.
The study has shown that by using more than one attribute to define your seismic facies, you are able to to gain a much more accurate representation of your facies distribution, which in turn enables you to better delineate your area of interest and thereby de-risking your well planning.
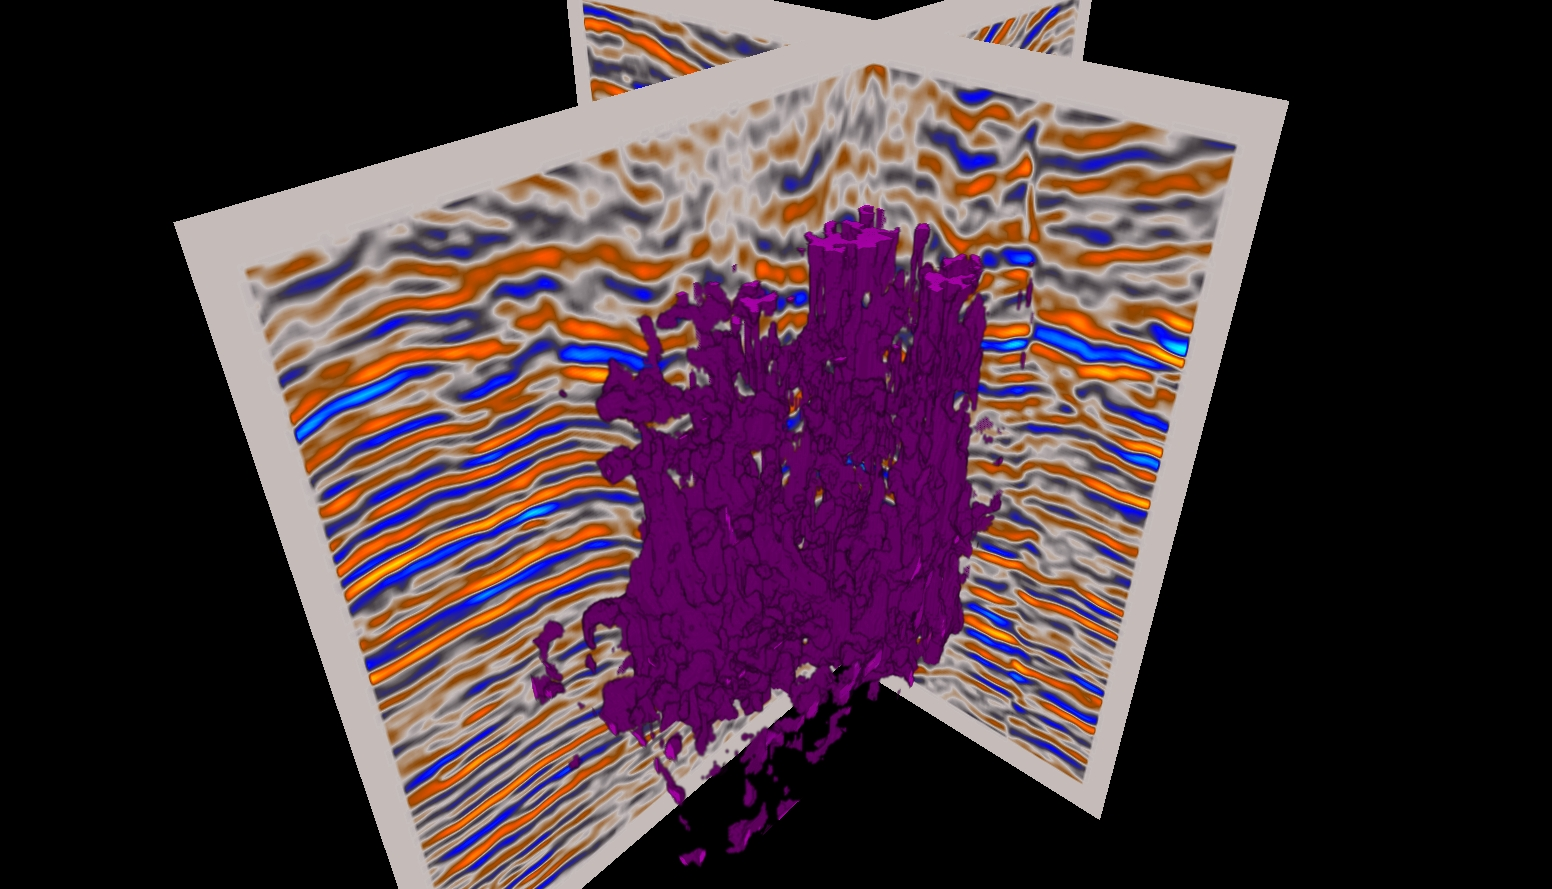 |
| GasChimney rendered in 3D |
