Earlier on this month we released the new High Definition Frequency Decompostion which is suitable to use with both broadband data as well as conventional seismic data. In this blog post we will explain what the actual difference is with the new technique.
The new version of HDFD has been modified to take into account the spectral extremes present in broadband data.
This is achieved by splitting the data into three frequency bands prior to running GeoTeric’s modified matching pursuit (HDFD) algorithm. This means that the underlying low frequency signal is “matched” by the dictionary of wavelets independently to the higher frequency events (and vice versa).
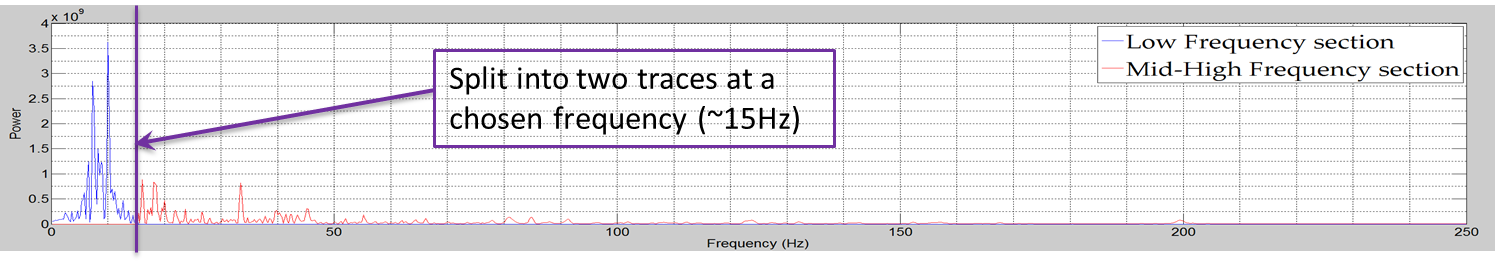
The HDFD algorithm pre-processes the seismic volume by splitting it into 3 band-limited volumes. For ease of depiction, an example trace with a single split at 15 Hz is shown below along with the proof of frequency splitting independence.
|
| Image showing Full Trace in Frequency Domain |
|
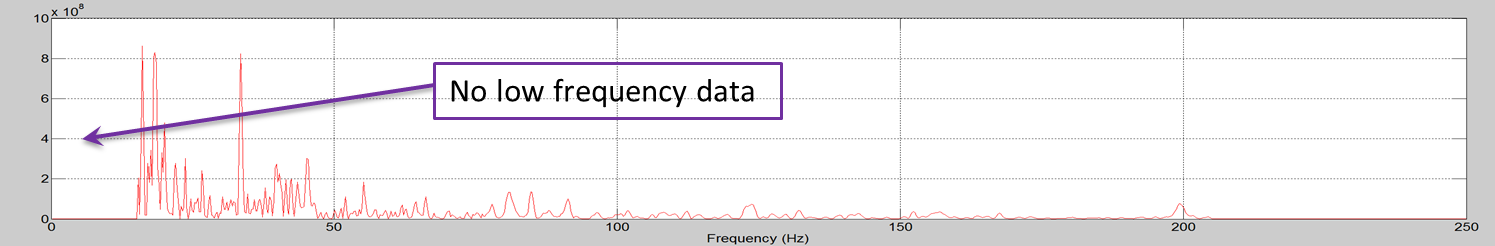
| Image showing FFT of low-frequency trace section |
|
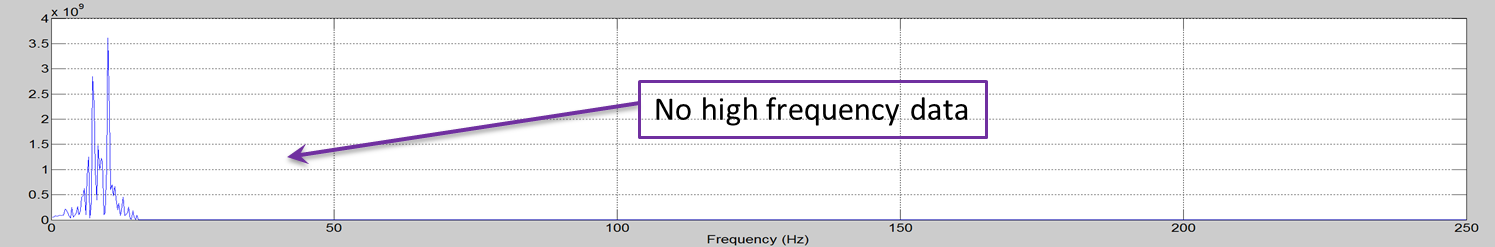
| Image showing FFT of high-frequency trace section |
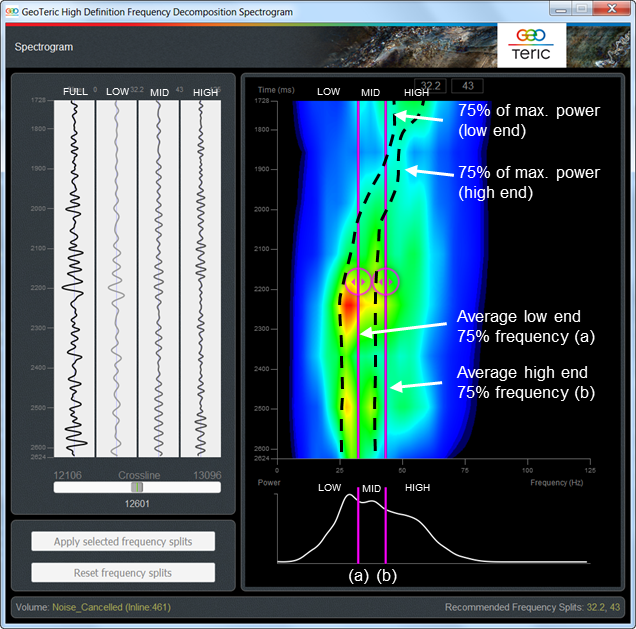
This technique requires a data-driven method for determining the optimal location for these splits in the frequency domain. This is achieved using a Q Trends analysis.
The spectral information from all of traces in the selected slice is collected and analysed to determine the low and high frequency at which the power is 75% of the maximum. The average value of the low frequency point of all the traces in the slice down the full trace length is calculated and used as the first split point.
The average value of the high frequency point of all the traces in the slice down the full trace length is also calculated and used as the second split point (see image below).