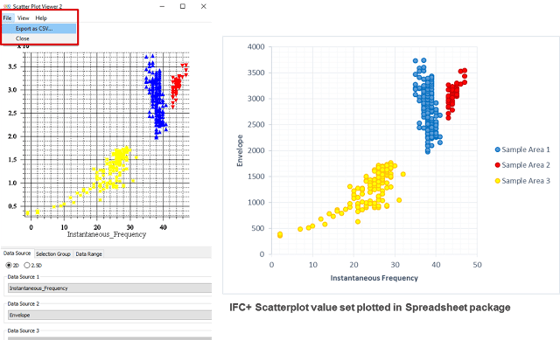
In GeoTeric 2016.2 the IFC+ now supports the ability to export data values for the selected clusters. This allows increased quantitative attribute analysis of specific areas/features of interest using external spreadsheet packages.

Step 1 – Open IFC+ and select volume(s) or colour blend to use for defining our clusters, this may be any volume/ blend which delineates an area which we are interested in.
Step 2 - Define cluster polygon(s) as target areas for quantitative investigation
Step 3 – Send the cluster points to the scatter plot tool in the IFC+ module
Step 4 – Choose the attribute volumes of interest for comparison of values within the defined polygon area(s). This can be 2 volumes (2D mode) or 3 volumes (2.5D mode). In addition, if the seed points are defined using well markers we it is possible to export attribute vs well log values.
(Note: If more than 3 attributes are required the process can be repeated in the same IFC session by opening an additional scatter plot for the same classification and using the additional attributes.)
Step 5 – Export the scatterplot point set to CSV file (File – Export as CSV…)
Step 6 – Open the CSV file which will contain columns of data representing the values of the cluster locations for the selected attribute volumes. These can then be plotted up against each other to produce graph and charts of the distribution of attribute responses for the points, within the defined polygon cluster.
Below are two short examples of how this can be applied for different types of analysis:
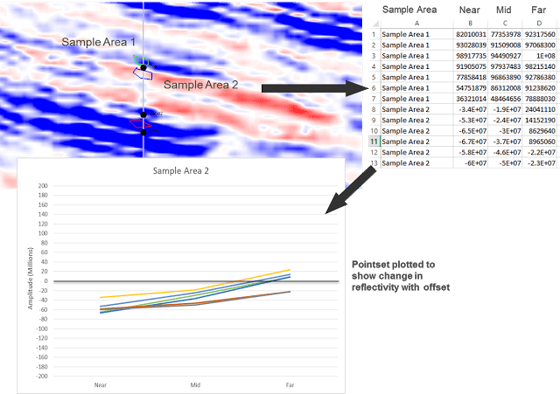
Example 1 – Exporting amplitude values for Near, Mid, Far stacks for AVO analysis:
By exporting the 3 amplitude sets we can investigate changes between the different angle stacks for our selected polygon areas. To do this use the 2.5D mode and select the Near, Mid and Far angle partial stacks as the inputs in that order. Note: the angle stacks should be loaded into GeoTeric with the same scaling applied to each volume to retain relative amplitude relationships.

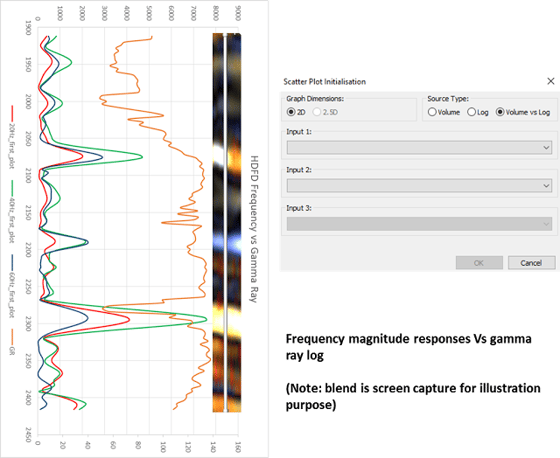
Example 2 – Frequency magnitude responses Vs well log
In this example we use the export functionality to output values for three HDFD magnitude volumes, a time volume and also a gamma ray log, along a well path. This then allows the three frequency decomposition magnitude responses to be plotted against the gamma ray well log values and ordered by the TWT.

