
The extended abstract is available here.
Enhancing the vertical resolution of data can bring a number of advantages to seismic interpretation. For example, edge breaks relating to faults or channel edges can be sharpened and made more apparent; or thin beds can be more accurately delineated, as these are often characterised by doublets. The Differential Enhancement method is able to resolve these doublets effectively by increasing high frequencies and supressing lower frequencies. This specific method of spectral enhancement can be of value to the interpreter who wishes to improve vertical resolution quickly as part of general reconnaissance objective so this can be therefore considered a fast-track method of Spectral Enhancement. Once a target interval is identified, it is recommended to use Spectral Expression where the spectrum can be shaped interactively and intuitively within an example driven framework.
Workflow:
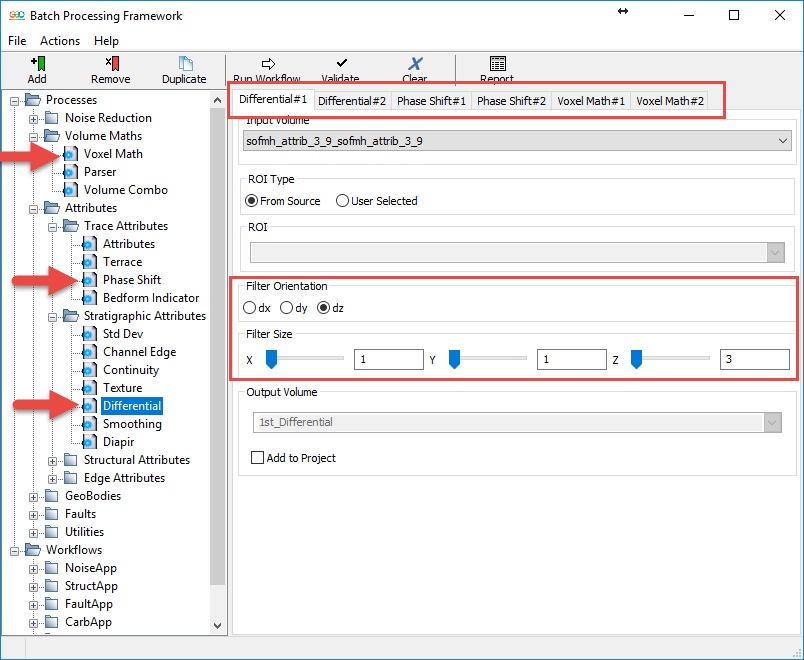
Figure 1: Batch Processing window with the steps for calculating the differential and Voxel Maths.
The first step is to open the Processes and Workflows (in the Reveal Module) and setting up the workflow by simply double clicking on the attribute tabs as shown in Figure 1.
- The Differential attribute (found in Stratigraphic Attributes) can be parameterised by selecting 'dz' and setting the filter size to 1x1x3. This orientates the filter so that the derivative analysis runs in the direction of the trace. The input for the 1st Differential should be the Noise Cancelled seismic volume, while the input for the 2nd Differential should be the 1st Differential.
- A 90-degree Phase Shift (found in Trace Attributes) should be run on the 1st Differential, and a 180-degree Phase Shift should be run on the 2nd Differential to align the phase of the output volumes.
- After which, the two Phase Shifted Differentials can be added together using Voxel Math.
- If the interpreter wishes to retain the low frequency information, the noise cancelled input can be added with the Differential Enhanced data, once again using Voxel Math.
These final two Voxel Math outputs, can be considered the final volumes. The entire workflow can be set up as a batch job, to be run in a single go. Since only one set of initial parameters needs to be set, this method of spectral enhancement is quite fast.
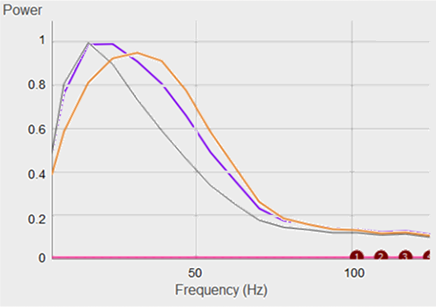
Figure 2: Frequency spectra. The yellow spectrum is the Differential Enhanced volume, the purple is the Differential combined with the Noise Cancelled volume and the black is the Noise Cancelled spectrum.
The yellow spectrum indicates the frequency content of the Differential Enhanced volume, while the purple spectrum indicates the frequency content of Differential Enhanced volume combined with the Noise Cancelled input for better retention of low frequency content. The black spectrum is the frequency content of the Noise Cancelled input. As can be seen in Figure 2, by adding the Noise Cancelled volume back into the Differential volume, the low frequencies are preserved, while the high frequencies are boosted.
The spectra of these volumes can be analysed in GeoTeric's Spectral Expression tool, by using the save and load option to overlay two spectra together at a time.
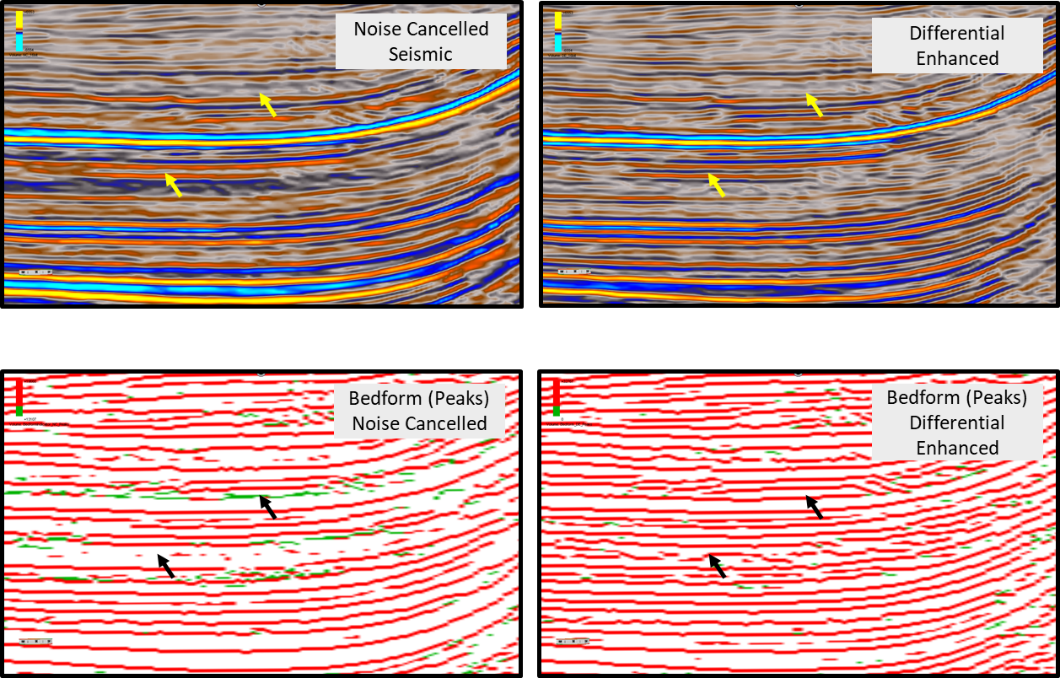
Figure 3: On the left is the Noise Cancelled volume, reflectivity (top) and Bedform (bottom). On the right is the Differential Enhanced, reflectivity (top) and Bedform (bottom).
The images above show how this method can aid in revealing potential thin beds by resolving doublets in the seismic data. The Bedform attribute (peaks option) was computed on the Noise Cancelled and on the Enhanced volumes. The green events on the Bedform indicate doublets. On the bedform calculated on the Noise Cancelled volume (Figure 3, bottom left), we can observe quite a few doublets in the image. On the Bedform calculated on the Differential Enhanced volume (Figure 3, bottom right), the majority of the doublets are now resolved.
The benefit of using this workflow in GeoTeric is that it can be done in a very fast manner, and further analysis can be performed later using Spectral Expression for a more in-depth spectral shaping analysis. Furthermore, because only the first two derivatives are used, there is a degree of confidence that there is no over-boosting taking place. Although the method can produce some suppression of lower frequencies, this can be addressed by adding the Noise Cancelled volume back into the Enhanced volume, as proposed in the step 4 of the workflow.
To view more information on how to use the Bedform Indicator to investigate Spectral Enhancement, please click here.
