
The Report View window is included among the many new features of GeoTeric 2018.1, such as Validate and the Master Project. It can be used to rapidly send items in the 3D Scene to a plan view for PowerPoint or other reporting documents. The value of this tool is most evident when dealing with large data as no time needs to be spent waiting for data to be extracted all over again. Whatever is in the 3D Scene will be sent to the Report View.
The window can be opened by the following ways: Top Menu Bar>View>Report View, pressing the hotkeys: Ctrl + W or by clicking on the following icon:

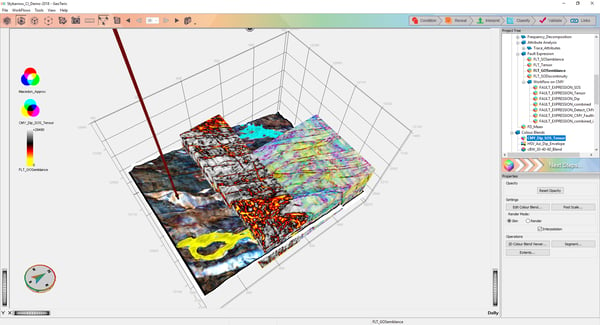
Figure 1: Project items visualised in the 3D Scene.
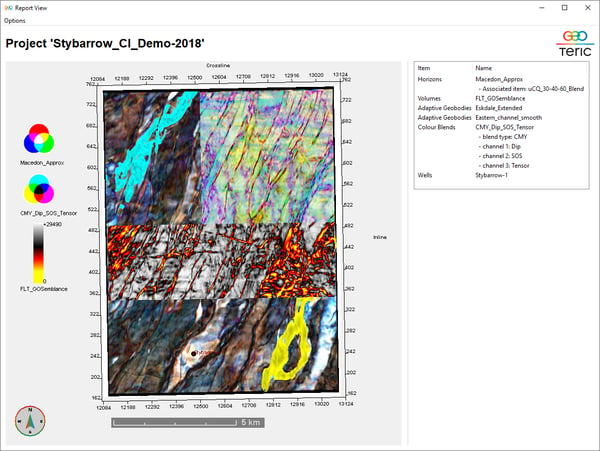
Figure 2: Project items sent to the Report View.
The window will automatically include a scale bar, north arrow and Grid/World Coordinates. Colour tables, if in the 3D scene will also be included. To the right of the window, is a box which includes a list of all the items that are visualised, horizons and blends will also include their constituent attributes. The image can then be copied to the clipboard or saved as a PNG. Further items can also be added to the Report View by simply adding them to the 3D Scene and then clicking Refresh View in Options at the top left corner of the Report View.
See the tutorial on report view
