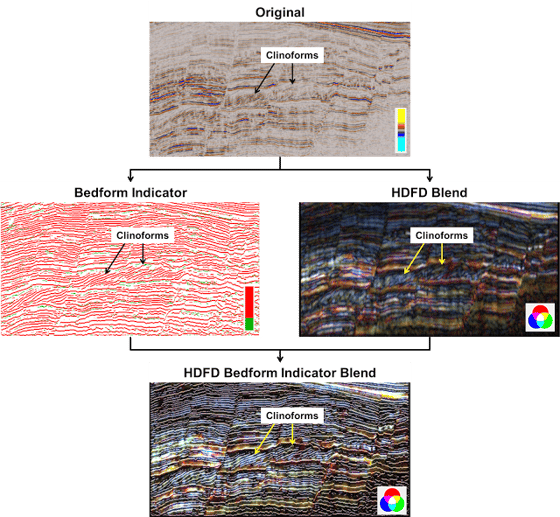
RGB Frequency Decomposition Blends are extremely useful in identifying both structural and stratigraphic events. These are best observed in the Z domain as the effects of vertical smearing are minimized. When observed along the inline or crossline it can be harder to trace the stratigraphic events.
Bedform Indicator is designed to skeletonize the seismic response to highlight the relationship between seismic strata within the data set. It highlights bedform features such as onlaps and clinoforms. So, by combining the Bedform Indicator volume with the RGB volume it will be possible to map and track sratigraphic features in 3D.
To undertake this process you will need a couple of pre-computed volumes. A Bedform Indicator volume preferably with Peaks or Troughs only is required and can be located in the Processing and Workflows option under the Reveal tab. Navigate to Attribute>Trace Attributes> Bedform Indicator. If Peaks and Troughs are selected then the combined blend image appears overcrowded with information.

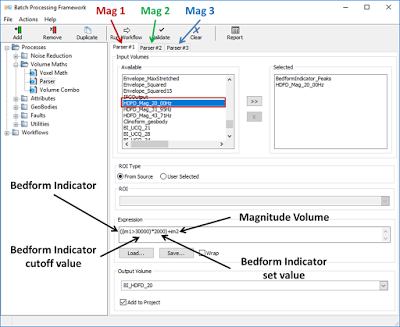
Now compute a RGB Blend, the process works for both standard Frequency Decomposition and High Definition Frequency Decomposition alike. Once the blend has been generated we need to imbed the Bedform Indicator volume into the individual magnitude volumes of the respective blend. This is undertaken in the Parser within the Processes and Workflows window. Here we need to input the Bedform Indicator as im1 and the chosen magnitude volume as im2.
We now indicate that where we get a Peak/Trough response in the Bedform indicator we would like to make this a set value, in this example 2000 was chosen. This value must be within the dynamic ranges of the three magnitude volumes, so no over stretching of the colour bar occurs.
This is then added to im2 (magnitude volume) to generate a magnitude volume with the bedform indicator imbedded into it. One this is repeated on the other two magnitude volumes they can be combined using the New Colour Blend tool.
Any post scale settings that were applied to the original blend can also be applied to replicate the response observed in the original blend. This combination process allows the user to have a strong visual understanding of the dataset in both a structural and stratigraphic nature. Allowing subtle stratigraphic features like clinoforms to be observed where they may not have been so visible in a RGB Blend in the inline and crossline orientation.


