By Randy Hee and Rachael Moore
Coherence Attribute
Coherence cubes calculated from 3D seismic provide a representation of the similarity (or dissimilarity) of the seismic waveforms and are therefore indicators of discontinuities in the seismic volume. One of the most common coherency algorithm employed is the well-known semblance, multi-trace correlation calculation (Marfurt et al., 1998) which identifies discontinuities and reflector distortions within the data.
Coherency attributes reveal shapes within the
GeoTeric offers a Structurally Oriented (SO) Semblance, where the algorithm aligns to the structure without the need to manually compute a separate dip steering volume.
Why Use More than Just Coherency Attributes?
In general, it's rare to image the majority of the structural edges within a seismic volume based on one single attribute response due to the complexity of the signal and heterogeneity of the subsurface environment.
Multi-attribute analysis can help to identify discontinuities that have a different expression in signal and improve
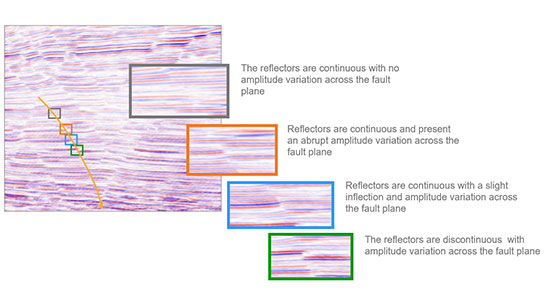
Figure 1: An example of a seismic section and how the fault expression changes along the fault.
In Figure 1, the seismic response of the fault changes over the fault length. It would be difficult for one attribute to identify the entirety of the fault because the fault is expressed as either a change in amplitude (subtle changes and large changes) or a change in phase.
A coherency volume would have difficulty detecting the fault in the orange and blue boxes due to the similarity of the reflectors on either side of the fault. The benefit of using more than one attribute helps to reveal more of the fault network that is not seen when a single attribute is used. Using a multi-attribute approach for fault definition allows the interpreter to obtain
GeoTeric uses a CMY colour blend to create the multi-attribute fault volumes, where the individual edge attributes are colour blended using a Cyan-Magenta- Yellow (CMY) colour scheme. Where the response from one attribute is dominant, that colour will be present in the CMY blend. A high response in all three attributes will result in black or dark colour in the CMY blend. Therefore, a high probability of faulting, expressed as high values in all three attributes, is defined by dark colours in the CMY blend.
There are two ways in GeoTeric to create the CMY blend. The first is generated from
The second way to generate a CMY is
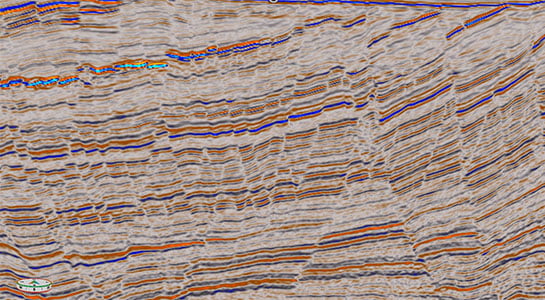
Figure 2: Seismic section showing different fault responses.
Figure 2 above, is a highly faulted seismic section. Figure 3, below, is the SO Semblance generated in GeoTeric, which is similar to a coherency volume. The majority of the faults are detected with the SO Semblance volume.
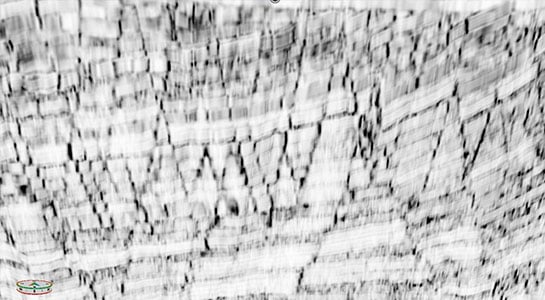
Figure 3: SO Semblance (Coherence Attributes) only captures fault response sensitive towards phase changes or breaks.
When the CMY is generated, see Figure 4, and each of the fault detections
The faults in Figure 4 that are green, are imaged by the Tensor and the Dip (Cyan + Yellow =
If all the faults were black in the CMY, then one attribute would be sufficient in detecting all the faults. Since this is uncommon, more than one attribute is needed. A CMY blend also aids in determining which attributes are contributing most to the fault detection.
In Figure 4, there are no yellow faults, meaning that the dip alone is not detecting any faults and another attribute could be substituted.
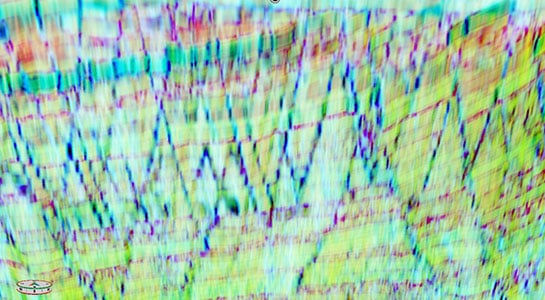
Figure 4: Example of CMY blend of Tensor-SO Semblance-Dip. Representing a complete fault network that related to amplitude change, phase change and orientation change.
Another benefit of the CMY blend over using one attribute is that the CMY blend is an average of all three attributes and helps to deter false positive faults.
The SO Semblance detects not only the
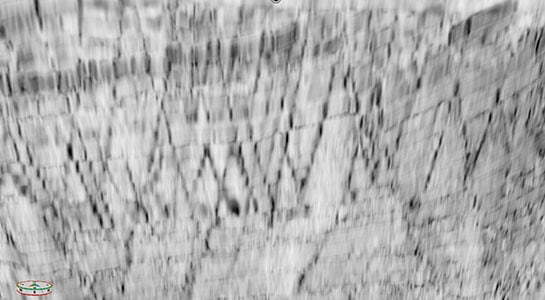
Figure 5: A single attribute that is a composite of 3 attributes that was combined using the CMY scalar.
Faults can be interpreted directly on the CMY blends in GeoTeric. Using multi-attributes to detect your faults and interpreting on multi-attribute volumes results in increased confidence of your interpretation, which subsequently forms the basis of your structural model.
For more information on a comparison between the edge attributes, click here. Or, for further reading on the application of CMY blends, visit these posts:
References:
- Marfurt, K.J., Kirlin, S.H., Farmer, S.H. and, Bahorich, M.S. [1998] 3D seismic attributes using a semblance based algorithm. Geophysics, 63, 1150 –1165.
- Bahorich, M.S., and S.L. Farmer, 1995, 3-D seismic discontinuity for faults and stratigraphic features: The coherence cube: The Leading Edge, v. 14, p. 1053-1058.
- Iacopini, R.W.H. Butler and S. Purves (2012), Seismic imaging of thrust faults and structural damage: a visualization workflow for
deepwater thrust belts, first break v.30, p.77-84