
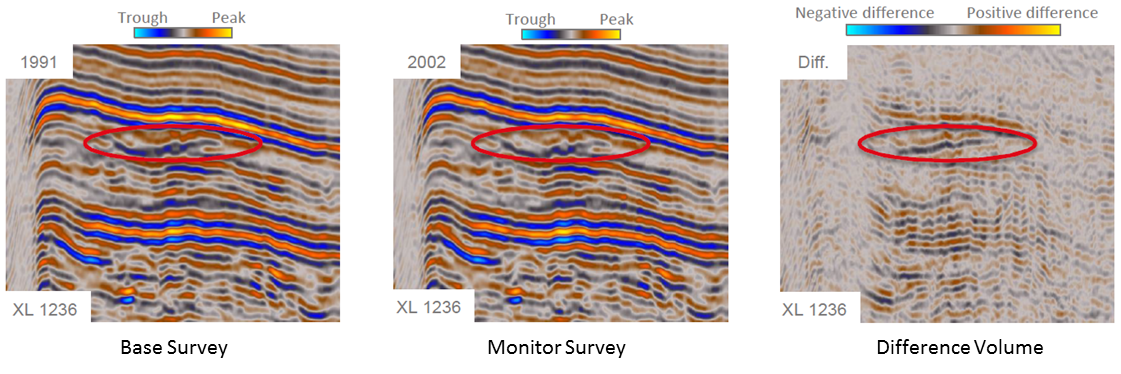
GeoTeric can effectively be used for 4D reconnaissance. This workflow can be used where we are unable to see fluid flow through the use of Frequency Decomposition RGB blending on the surveys and their difference volumes. By using a hypothesis that where hydrocarbons are removed as a result of production and replaced with another fluid such as water, the decreasing acoustic impedance contrast will cause the reflector strength to decrease between a base survey and the monitor survey.
The main limitation of this workflow however, is that we will be ignoring the values where the monitor survey has greater reflector strength than the base survey. These areas will be appearing as black in subsequent volumes.
Calculating Reflector Strength Decrease:
This can be done by using the expression below:
(((im1>0 & im2>0) | (im1<0 & im2<0)) & (im1/im2)<=1)*(100-(im1/im2)*100)
Where im1 is the monitor surveyand im2 is the base survey. The symbol: | represents the “logical or” function.
The expression has three conditions prior to calculating the percentage of reflector strenght decrease:
- The green part, separates out the positive reflector values for both the monitor and base surveys.
- The blue part, separates out the negative reflector values for both the monitor and base surveys.
- The orangepart, selects voxels where there is a decrease in amplitude in the monitor survey compared to the original.
Finally the red part, shows the decrease as a percentage of the original survey.

After generating this volume, select the “Body Spectrum” colour map. By moving your mouse over any inline, crossline or timeslice you will be able to read off the value from the bottom of the GeoTeric window. From the example timeslice above, we can read off a value of 42. This means that there is a 42% decrease in reflector strength between the base and monitor survey.
Binning the Results:
If we want to view these results on a horizon in a quantifiable way, the results can be binned with a colour assigned to each bin. If for example we want to look at reflector strength decrease of up to 50%, at intervals of 10% (ie: 5 bins) we can use the following expression:
(im1>0 & im1<=10)*10+
(im1>10 & im1<=20)*20+
(im1>20 & im1<=30)*30+
(im1>30 & im1<=40)*40+
(im1>40)*50
Where im1 is the Reflector Strength Decrease volume.

Once this volume has been generated, it can be taken into the IFC+ tool to quickly assign colours to each binned interval; alternatively it can be viewed using the “Body Spectrum” colour map.
(By Abdul Cader and Peter Szafian)
