
The application of data conditioning, frequency decomposition and RGB colour blending in the Gohta discovery
(Barents Sea, Norway)
(Barents Sea, Norway)
By Syed Fakhar Gilani (formerly at NORECO, now at DEA E&P, Stavanger) and Luis Gomez (GeoTeric, London)
(published in First Break December 2015)
Geological Expression workflows, involving data conditioning and frequency decomposition can be used to detect subtle changes within the seismic signal, increase the confidence on the seismic interpretation and de-risk exploration and appraisal wells. This paper looks at the application of these workflows to the Permian carbonates in the Gohta discovery (Barents Sea, Norway) and how the results can help to increase the confidence on the proposed appraisal program.
As a preparation for the rest of the workflow, the data was conditioned using post imaging techniques. The first step involved noise cancellation of the seismic data using structurally oriented and edge-preserving algorithms. An area of poor quality data due to shallow gas clouds was identified to the south of the Gohta structure. In this area, a stronger noise attenuation workflow followed by an amplitude normalisation was applied to increase the reflector continuity. Both noise cancellations were then combined and this noise cancelled dataset was used as an input for the spectral enhancement, which involved an enhancement of both the low and the high frequencies, aiming for a white spectrum.
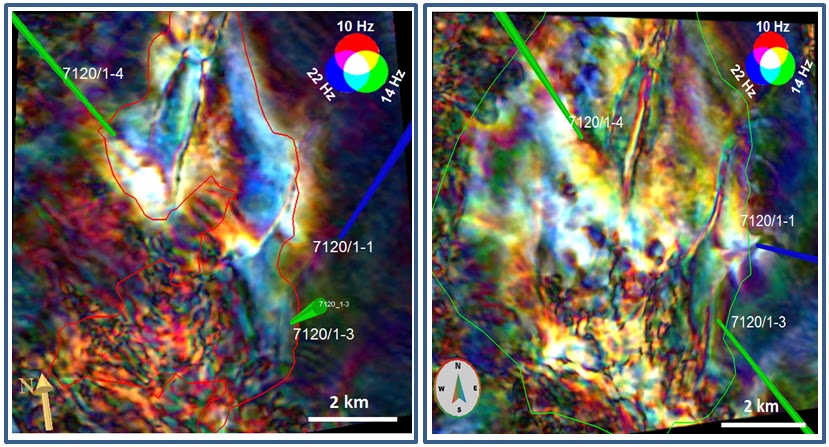
Frequency decomposition and RGB blending were applied to the enhanced data, using two different methods: one involving a short window-based Fast Fourier Transform, and the other one involving an adaptive matching pursuit algorithm. The bright colours observed in the blends were interpreted as an indicator of the presence of oil and gas, while colour changes were interpreted as changes in reservoir thickness, lithology or fluid content.
The results of this work supported the presence hydrocarbons on the proposed location of the Gohta appraisal well (7120/1-4 S), which was drilled in 2014 and encountered gas but the testing in the oil zone was inconclusive because of the technical problem of isolating gas flow from the oil zone, proving the validity of this technique as a DHI.
If you are an EAGE member, download the full paper here
If you are an EAGE member, download the full paper here
 |
|||
| Time-slices through the gas cap (left) and oil leg (right), showing the Constant Q RGB blends generated on the conventional spectral enhanced dataset. |
