
GeoTeric offers a number of workflows that allow a QC of the phase alignment between multiple volumes. These workflows can be used to analyse the similarity between angle stacks or 4D vintages. This enables the user to assess the phase alignment of the data to ensure an accurate analysis of the data.
Peaks and troughs replacement
The peaks of stack 1 can be replaced by the data from stack 2. If they are phase aligned, the result will be a peak. If they are misaligned, the result will be a trough. The troughs from stack one will be ignored and replaced by zeros.
This volume can be produced by selecting the two stacks in the Parser and using the expression (im1>0)*im2
The Parser is available in Processes & Workflows -> Processes -> Volume Maths -> Parser.
In a similar way, the troughs of stack 1 can be replaced by the data from stack 2. If they are aligned, the result will be a trough. If they are misaligned, the result will be a peak.
This volume can be produced by using the expression (im1<0)*im2 in the Parser.
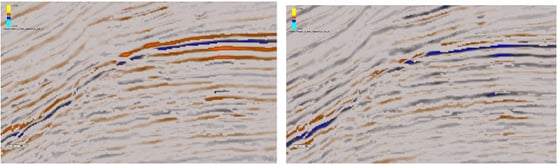 |
| Example from the Parihaka dataset, offshore New Zealand. On the left, peaks in the near have been replaced by the far, so troughs indicate misalignment. On the right, troughs in the near have been replaced by the far, so peaks indicate misalignment. |
Bedform stack
A much more detailed similarity analysis can be achieved by using a Bedform stack.
The Bedform indicator attribute can be computed for each of the stacks, and then multiple Bedform attributes can be combined using a Parser expression to create the Bedform stack.
To combine three Bedform indicators, we can use the following Parser expressions depending on the data type.
For 32bit:
((((im1>700000000)*im1)+((im1<-700000000)*im1))+(((im2>700000000)*im2)+((im2<-700000000)*im2))+(((im3>700000000)*im3)+((im3<-700000000)*im3)))/3
For 16bit:
((((im1>10000)*im1)+((im1<-10000)*im1))+(((im2>10000)*im2)+((im2<-10000)*im2))+(((im3>10000)*im3)+((im3<-10000)*im3)))/3
For 8bit:
((((im1>170)*im1)+((im1<90)*im1))+(((im2>170)*im2)+((im2<90)*im2))+(((im3>170)*im3)+((im3<90)*im3)))/3
These Parser expressions are simply (im1+im2+im3)/3, but removing the doublet values in each of the Bedform attributes.
If the output is visualised using the Azimuth colour map, good alignment will be seen in black, areas with dispersion along a peak in red, and areas with dispersion along a trough in blue. The lighter the blue and red colours, the worse the alignment.
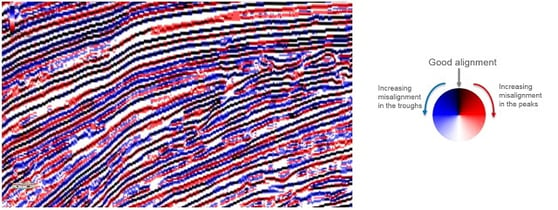 |
| Example from the Parihaka dataset, offshore New Zealand. The bedform stack has been computed using the near, mid and far angle stacks. |
Alignment quantification workflow
To quantify the alignment between two stacks (im1 and im2), the following Parser expression can be applied:
((im1>0)&(im2>0))*1+((im1<0)&(im2<0))*1+
((im1<0)&(im2>0))*-1+((im1>0)*(im2<0))*-1+
((im1=0)&(im2!=0))*-1+((im2=0)&(im1!=0))*-1+
((im1=0)&(im2=0))*1
This will produce a volume with
+1 when there is good phase alignment between the stacks
-1 when there is bad phase alignment between the stacks
Note that any blank areas in any of the stacks will bias the results, so it is recommended to apply this workflow on a subset around the area of interest.
By using the Voxel Pick tool, available in the properties panel when highlighting the volume, a voxel pick can be placed for a +1 value and another one for a -1 value. Going to the Picked voxels tab, the two picked voxels will be displayed. Right clicking on each of them will bring up the Measure option, which allows a measurement of the number of voxels within the dataset that have the value of the picked voxel. Using the default options in the measure tool we can eaily get the number of voxels with a +1 value, and we can repeat the process for the voxels with a -1 value.
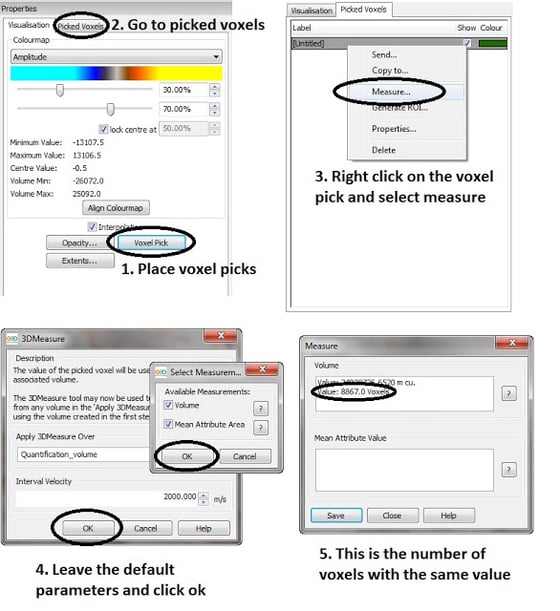
This way, as the number of voxels with a +1 value and the number of voxels with a -1 value is known, a simple ratio or alignment percentage can be manually calculated.
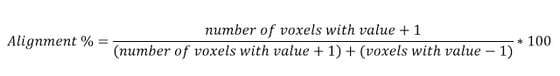
If the alignment is close to 50%, that is a bad alignment, as it means a peak in stack 1 has almost the same likelihood of being a peak or a trough in stack 2. Anything close to 90% or 100% means there is a good phase alignment.
Conclusion
Using GeoTeric we are able to check if the stacks are aligned properly or not. If there is a large amount of misalignment, the user should consider reprocessing or recreating the angle stacks before continuing with the AVO or 4D analysis.
Conclusion
Using GeoTeric we are able to check if the stacks are aligned properly or not. If there is a large amount of misalignment, the user should consider reprocessing or recreating the angle stacks before continuing with the AVO or 4D analysis.
