

Why should you do your colour blending in Geoteric?
Colour blending is one of the most powerful visualisation tools currently available to geoscientists. Through this one simple process, the user is able to concurrently view the information from three different volumes, allowing them to interpret their data with more confidence. While there are other methods of interrogating multiple volumes, none offer the same level of data density at one time and although interpretation can be done by moving between multiple volumes, it is far more difficult to notice subtle variations.
Geoteric has been at the forefront of colour blending technology for over a decade, and has made this a core part of the package. Colour blending is the ideal complement to our Frequency Decomposition and Fault Expression tools, plus many other advanced workflows.
The key benefits to using Geoteric for your colour blending are:
- Exceptional colour resolution
- An intuitive interface, with all the tools to optimise your blend efficiently
- A wide range of colour blend types (RGB, CMY, HSV)
- Interactive previews of your results
- An extensive range of advanced colour blending workflows
- The most complete colour blend interpretation package
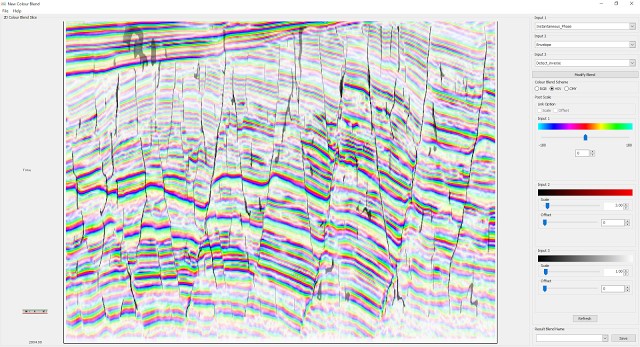
Figure 1. New Colour Blend Tool showing and inline preview of a HSV Blend.
How to create a New Colour Blend?
Several tools within Geoteric make use of the colour blending functionality to get the best possible results. For instance, Frequency Decomposition is perfectly suited to colour blending since there are subtle differences between the three input volumes.
There are a number of advanced workflows that create valuable blends from volumes created individually in your project, such as creating a blend to highlight AVO anomalies. You can also blend any three volumes available within your project, although you should generally use attributes with only positive values. To create a blend from any of these volumes you simply need the New Colour Blend tool (above). This can be accessed by clicking on the 'Colour Blend' directory in your project tree and selecting 'New Colour Blend'. Once you have entered the tool:
- Select the three volumes from the three drop downs.
- Click 'Set Blend'
- Select a Slice or Horizon to be used for your preview.
From the preview display, you will also be able to balance the three inputs of your blend. The contrast value can be lowered to make the dark areas more visible.
The scale option can be left on Max Stretch, unless you are creating an AVO Blend, in which case Uniform Stretch should be chosen. Max Stretch will scale each input volume to the maximum data range, either 16 bit or 32 bit. The Uniform Stretch will apply the same scale factor to all three input volumes. Once it is acceptable, enter a blend name and click Save.
For a video on how to create a new Colour Blend in Geoteric, click here.
What is the difference between RGB, CMY and HSV?
The three colour blend types available within Geoteric are RGB, CMY and HSV. The RGB is the most commonly understood blend, and has been in use in the industry for many years. RGB Blends are created by assigning the three volumes to the red, green and blue channels. A higher value results in a brighter colour in that channel. RGB is an additive blend, meaning that when two channels have high values in one part of the blend, it is the same as those two colours being mixed. Thus, when red and green have high values, we have a yellow response. And when all three have high values, we have a white response.
This is valuable in cases such as AVO Blends, where the envelope of the Near, Mid and Far angle stacks are being blended, a high value means a stronger amplitude in that particular angle stack. For more information on AVO Blends within Geoteric, please click here.
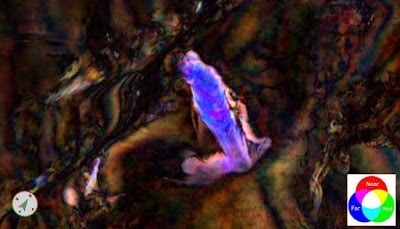
Figure 2. AVO Blend on the Parihaka 3D dataset.
CMY Blends are created by assigning the three attribute volumes to the cyan, magenta and yellow channels. CMY is a subtractive blend, meaning that when two channels have high values in one part of the blend, it is the same as two filters of those colours being mixed. Thus, when cyan and magenta have high values, the result in the blend is a dark blue response. And when all three have high values, the result is a black response. This is valuable in cases such as Fault Expression, where high values are indications of a possible fault.
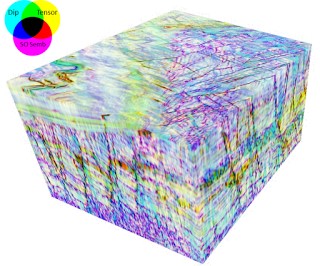
Figure 3. A CMY Blend created from Fault Expression
HSV Blends are created by assigning three attribute volumes to the Hue, Saturation and Value channels. The most commonly used HSV Blend is the Geoteric Interpretation HSV. In this blend:- Changes in Hue (colour) are controlled by the Instantaneous Phase attribute.
- Changes in Saturation of the colour are controlled by the Envelope attribute.
- Changes in Value (blackness) are controlled by the Fault Detect attribute.
With this blend we are provided with a single dataset that explicitly displays the phase information in great detail, retains the amplitude information and includes fault information to guide interpretation. For more information on how to create a HSV blend for interpretation, please click here.
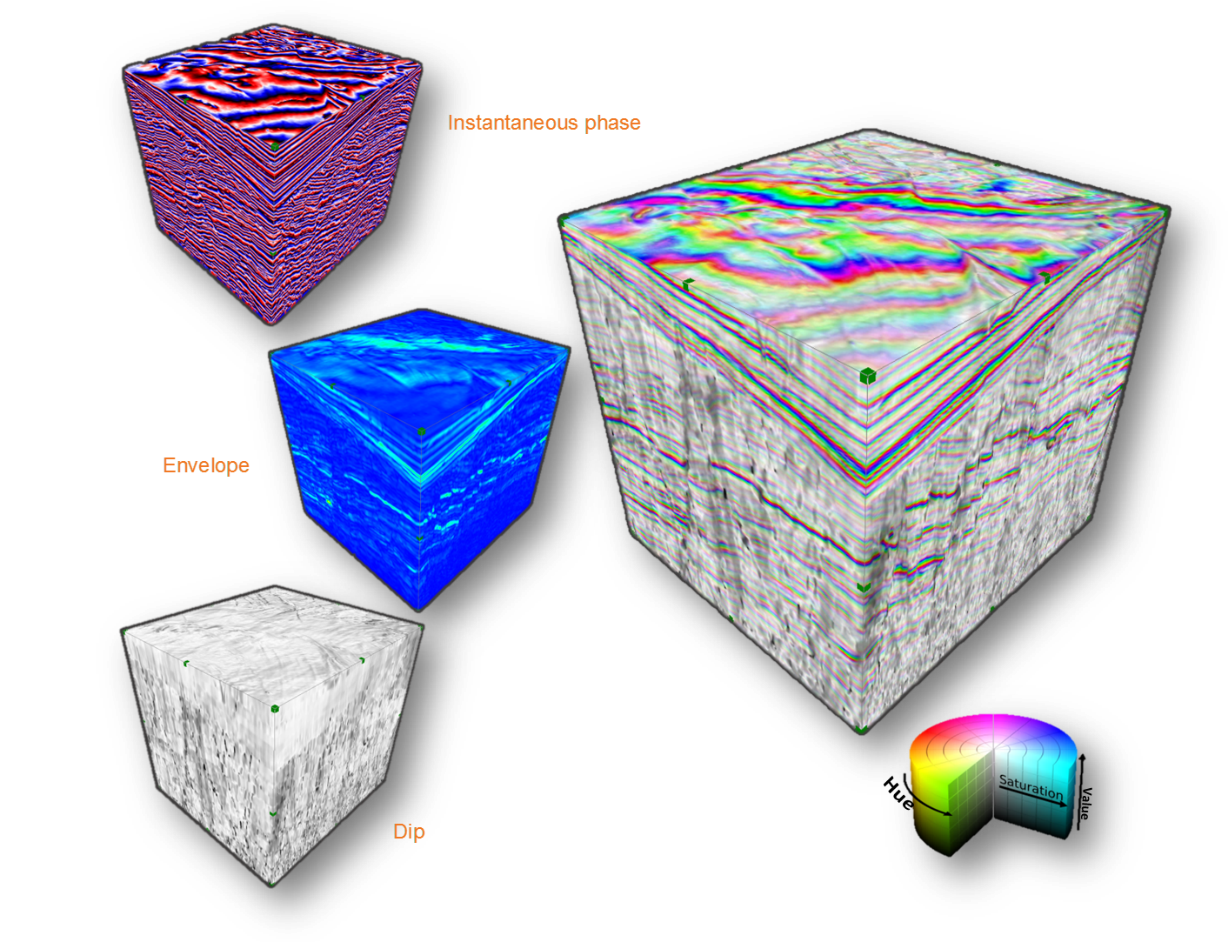
Figure 4. An Interpretation HSV blend, with the constituent volumes.
How the Interpretation HSV helps in interpretation
Because of the three key components encoded in the Interpretation HSV Blend, it provides several significant benefits:
- Improved visual separation of packages
- Interpretation based on detailed phase information
- Interpretation that honours fault locations
- Reduced cycle skipping in auto-tracking
Having the phase information control the Hue in this blend means that an entire spectrum of colours are used for each wavelet cycle, rather than the three colours of a normal colour bar for reflectivity. This allows the user to more easily differentiate packages, especially in poorly imaged sections, and also to see geometries more easily.
The blending of the Instantaneous Phase, Envelope and a Fault attribute is highly beneficial in auto-tracking. GeoTeric's Adaptive Horizons tool is the only tool created to interpret on colour blends. By providing a blend with these components, the tool is able to interrogate the seismic in far greater detail. This results in horizons that can be picked on a particular phase angle, less cycle skipping and honouring of fault information when interpreting.
A blog post will follow soon on the value of the Interpretation HSV in GeoTeric's Stratigraphic Slicing Workflow.
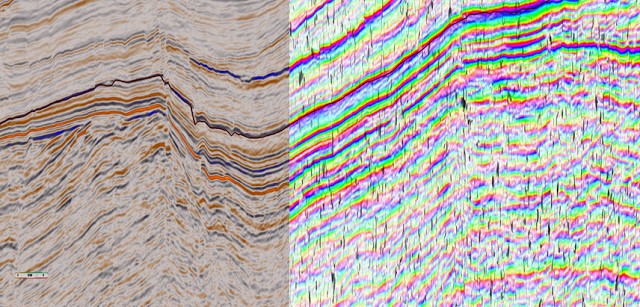
Figure 5. A comparison of a Refelctivity volume and Interpretation HSV blend.
For a video on how to interpret on a HSV Interpretation Blend, click here.
Opacity Blends
Structural and stratigraphic attributes can be blended together and their opacity set to allow information from both volumes to be displayed as one. Opacity Blends provide a deeper insight into:
- The geological interplay between identified structures and stratigraphic bodies
- The geometry of identified features and their relationship to potential prospects.
Opacity Blends allow the user to overlay attribute volumes together, or to overlay attribute volumes with colour blends. Each attribute has its own colourmap and opacity set separately. The opacity of one layer will effect what is seen in the subsequent layers, since the volumes are overlaid one on top of the other. Therefore if the first layer is completely opaque, the other layers will not be seen.
Examples of Opacity Blends in Geoteric are:
- Combining a RGB Blend with a Fault Attribute, like the Dip, So Semblance or Tensor
- Blending the Envelope with a Fault Attribute
- Blending the Chaos, a Fault Attribute and RGB Blend, see example below
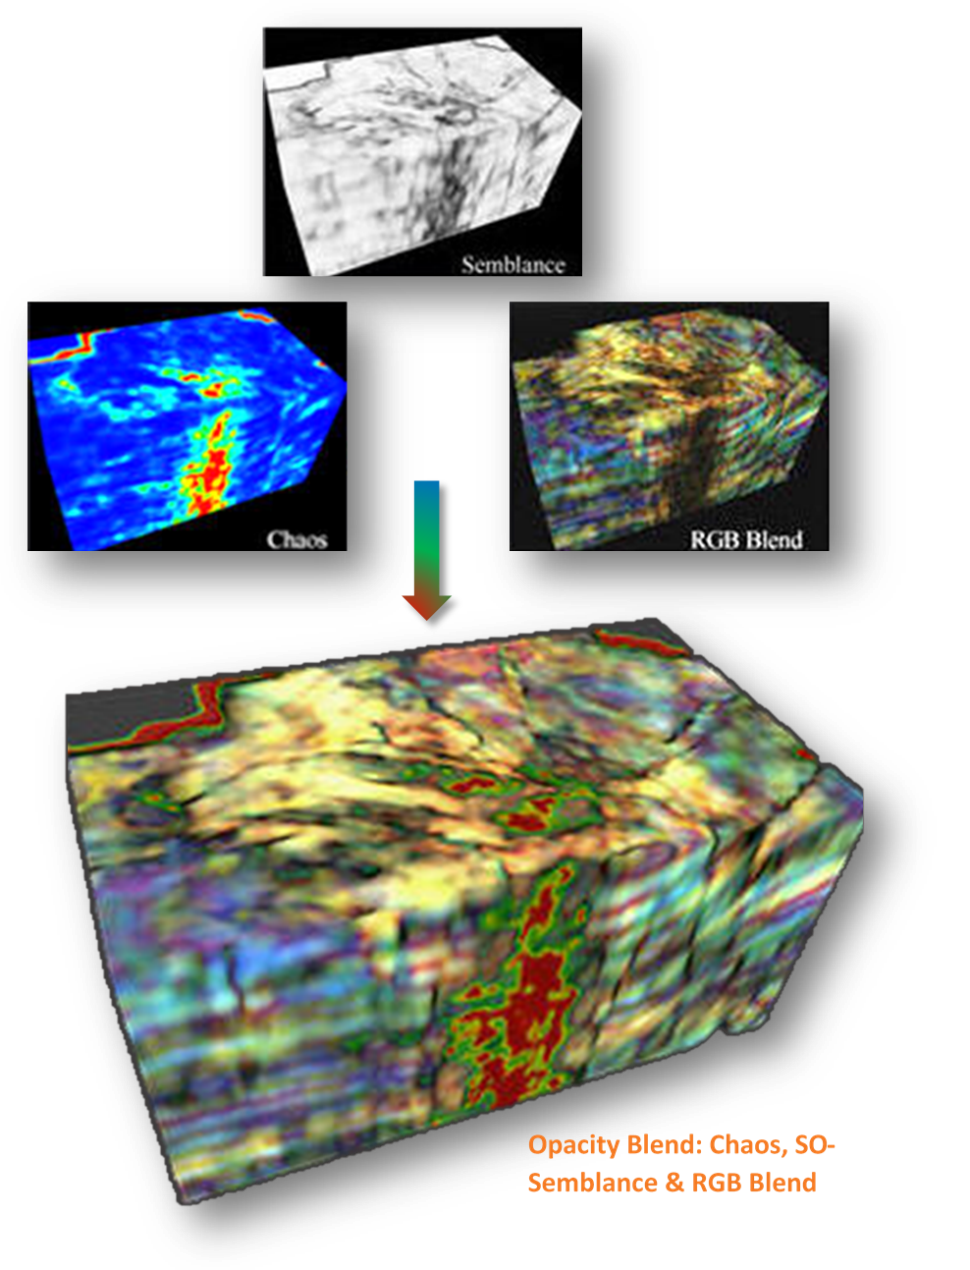
Figure 6. Opacity Blend of Chaos, SO Semblance and a RGB Blend.
In the example above, the Chaos highlights the gas chimney, the SO Semblance highlights the faults associated with the gas chimney and the RGB Blend provides regional stratigraphic information. Please see the short video for more information on creating multi-attribute Opacity Blends, here.
Using blends to display more than one attribute volume in the main 3D window
Have you ever wanted more than one attribute volume displayed in the main 3D window? This can be easily accomplished by creating a blend of a volume or an attribute with itself. For example, to determine how the seismic is changing between the near and far stack, just create a Opacity Blend of the Near Stack reflectivity with itself twice and leave the opacity set at 100% for both inputs.
In the main 3D window you are now able to display the Near Stack Opacity Blend and the Far Stack reflectivity volume and move both probes around as needed.
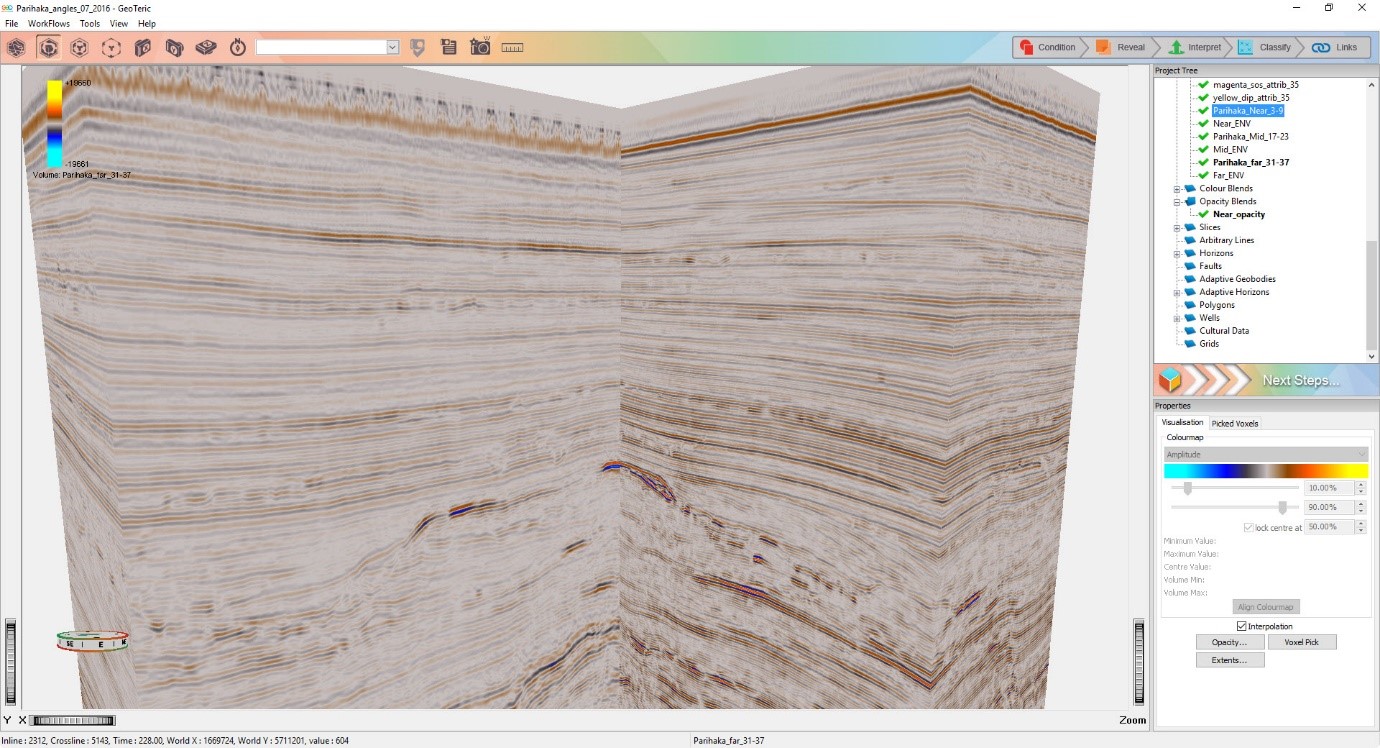
Figure 7. On the left is the Far Stack volume, on the right is the Near Stack Opacity Blend, this allows for easy visualisation of how an event is changing between the near and far stacks.
Enhancing your stratigraphic features on RGB Colour Blends
RGB Colour Blends reveal a wealth of stratigraphic information. By incorporating an Edge Attribute with the RGB Blends, the resulting blend will contain both the stratigraphic information and structural information. One way to create this blend is by creating an Opacity Blend of the RGB Blend and an Edge Attribute, as discussed above. One drawback with this method, is that while the image reveals a wealth of stratigraphic and structural information, at this time it is not possible to interpret on an Opacity Blend. Therefore, by using the Parser, the Edge Attribute can be combined with each individual Magnitude volume which forms the RGB Blend. These Magnitude volumes can then be re-blended using the Colour Blend tool to create a RGB Blend with both structural and stratigraphic information.
For a video on how to embed your faults into the Colour Blends, click here.
A detailed workflow can be found on GeoTeric's blog, please click here.
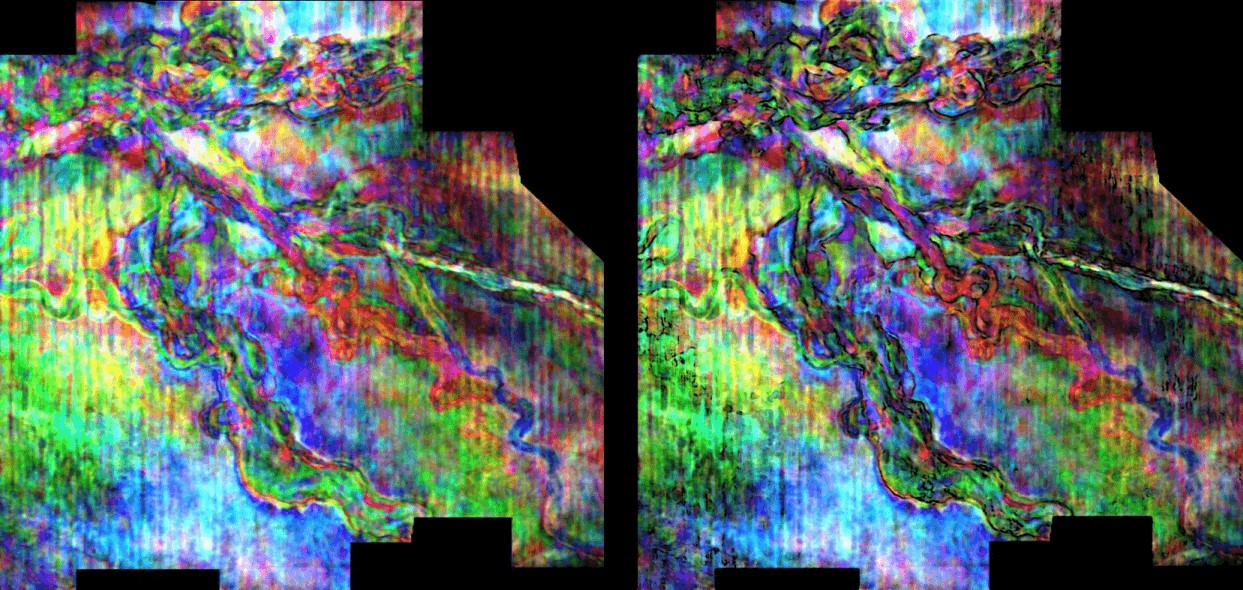
Figure 8. On the left is the original RGB Blend on the right is the RGB Blend embedded with an Edge Attribute.
All data is courtesy of the New Zealand Petroleum and Minerals and Geoscience Australia.
